Is the value premium readily accessible for individual investors? Which value strategy works best? In his May 2009 article entitled “Can Individual Investors Capture The Value Premium?”, Patrick Larkin uses a ranking methodology to compare the performances of Joel Greenblatt’s magic formula and seven other one and two-factor growth at a reasonable price (GARP) and value strategies. The portfolios for the eight strategies derive from rankings on: (1) the magic formula, a combination of return on capital (ROC) and the ratio of earnings before interest and taxes to Enterprise Value ((EBIT/EV); (2) a combination of return on assets (ROA) and earnings yield (E/P); (3) a combination of return on equity (ROE) and E/P; (4) EBIT/EV alone; (5) E/P alone; (6) a combination of book-to-market ratio (B/M) and market capitalization (Size); (7) B/M alone; and, (8) Size alone. Each month, the author forms equally weighted portfolios of the 30 highest-ranking stocks for each of these eight strategies. Using monthly stock return and GARP-value metric data for a broad sample of firms with market capitalizations over $50 million during December 1998-2006 (97 months), he finds that:
- The GARP-value-size strategies tend to select small capitalization stocks.
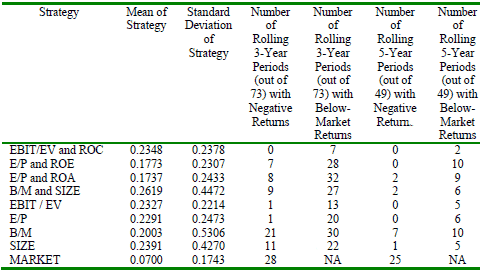
- All eight strategies substantially beat the broad stock market based on average returns over the 97 rolling one-year holding periods in the sample (see table below). Apparently, simple strategies can continue to work even after investors are broadly aware of them.
- While the eight strategies have higher standard deviations of returns across the 97 rolling one-year holding periods than the broad stock market, they are less likely to produce negative returns over any three-year or five-year period.
- To benefit from GARP-value-size strategies, it appears that investors must be able to resist bailing out during occasional intervals of underperformance.
The following table, extracted from the article, lists performance metrics for the eight GARP-value-size investment strategies as calculated from 97 rolling one-year holding periods. The magic formula (EBIT/EV and ROC combined), EBIT/EV alone and E/P alone have similar outstanding average returns and relatively low standard deviations of returns. The magic formula excels in risk management, never in the red for any three or five-year period and underperforming the broad stock market in only seven (two) of 73 rolling three-year (49 rolling five-year) periods. EBIT/EV alone and E/P alone also perform reasonably well on risk measures. B/M and Size combined have the highest average annual return (26.2%) but also a very high volatility.

Results do not address trading frictions or portfolio turnover. Including 97 monthly iterations of associated costs would materially reduce returns. Differences in these costs among strategies could affect their relative performance.
Note that the sample period for this study is relatively short, with effective sample size much smaller than 97, 73 or 49 because of the large overlap in rolling periods.
In summary, evidence from narrow portfolios (top 30 stocks) over a recent short test period indicate that GARP-value-size strategies perform well, with the magic formula (EBIT/EV and ROC combined), EBIT/EV alone and E/P alone excelling.