The Value Line Select ETF (VLSE) Index “is an equal-dollar weighted index comprised of between 30 and 100 U.S. traded ETFs ranked #1 by Value Line Publishing, Inc… The Value Line ETF Ranking System seeks to select the ‘best-for-investment’ ETFs among all U.S. traded ETFs…approximately 10% of all traded ETFs but no more than 100 ETFs. The Value Line Select ETF Index is rebalanced and reconstituted once per quarter… Upon Value Line Select ETF Index’s introduction in 2008, the index values were computed on a daily basis dating back to 2003 to provide a historical frame of reference.” Does this approach to ETF investing beat the market? Using self-reported daily performance data for the VLSE Index over the period 10/21/02 through 8/14/09 (almost seven years), and contemporaneous daily returns for S&P Depository Receipts (SPY) for benchmarking , we find that:
In the following analyses, we assume that the quarterly trading friction, imposed on the last trading day of each calendar quarter, is 0.5%. In general, quarterly rebalancing makes results fairly insensitive to variation in the assumed trading friction. Trading friction in a real account would depend on actual portfolio turnover, the liquidity (bid-ask spreads) of ETFs traded, specific broker transaction fees and account size.
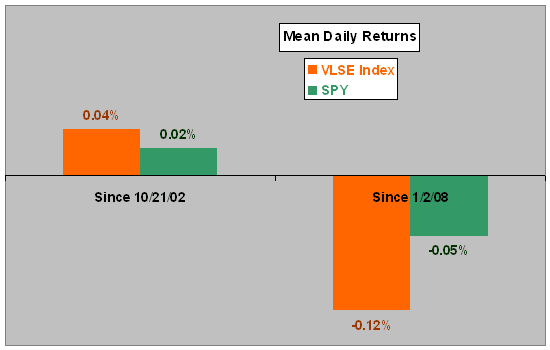
The following chart compares the average (arithmetic mean) daily returns of the VLSE Index and SPY over the entire sample period and over the short “live” subperiod since the beginning of 2008. The VLSE Index outperforms SPY over the entire sample period but underperforms over the live subperiod. The standard deviation of daily returns for the VLSE Index (1.57%) is higher than that for SPY (1.28%) since 10/21/02. From 1/2/08 onward, the standard deviations of daily returns are about equal for the VLSE Index and SPY (2.4%).
For a different perspective, we look at cumulative returns.
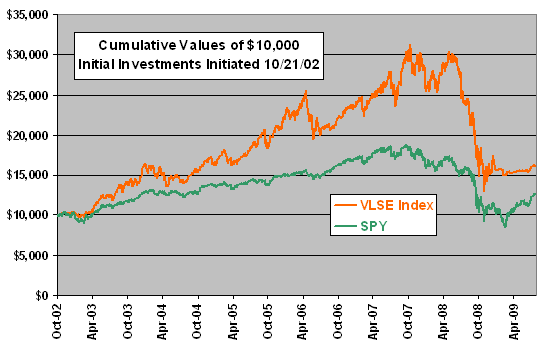
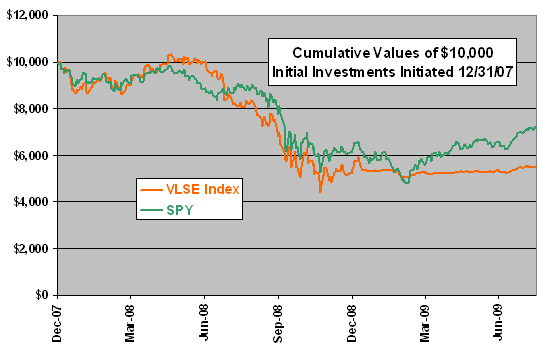
The next two charts track the daily values of $10,000 initial investments in the VLSE Index and SPY over the entire sample period (upper chart) and over the live subperiod starting at the beginning of 2008 (lower chart).
The upper chart shows that the VLSE Index achieves a higher terminal value than SPY ($16,146 versus $12,668) over the entire sample period. The VLSE Index outperforms for this test as long as its quarterly rebalancing friction is less than about 1.4%.
The lower chart shows that the VLSE Index achieves a lower terminal value than SPY ($5,479 versus $7,150) during the live subperiod since the beginning of 2008. SPY has higher terminal value for this subperiod even if the quarterly rebalancing friction for the VLSE Index is zero.
Cumulative return analyses can be very sensitive to the specific start and stop dates used.
Next, we look under the hood via regressions.
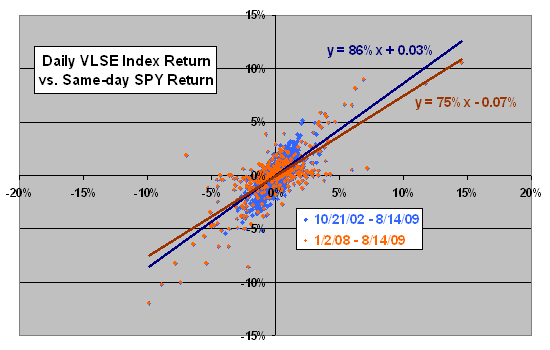
The next chart relates daily VLSE Index returns to same-day SPY returns over the entire sample period and over the live subperiod starting at the beginning of 2008. Over the entire sample period (live subperiod), alpha is positive (negative) per the results of the analyses above.
What might be the expectations for the VLSE Index in rising and falling stock markets?
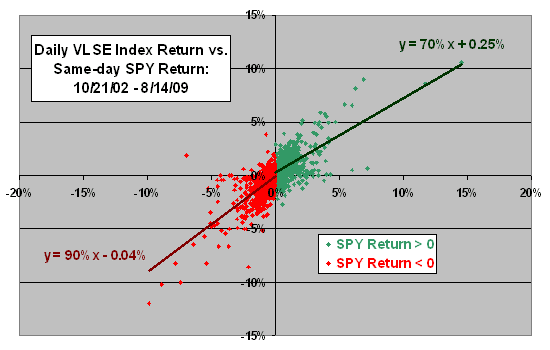
The final chart relates daily VLSE Index returns to same-day SPY returns over the entire sample period when SPY returns are positive and and when SPY returns are negative. On bearish (bullish) days, the VLSE Index exhibits negative (substantially positive) alpha and elevated (suppressed) beta. The higher beta for bearish than bullish days suggests that the VLSE Index does a poor job of timing the U.S. equity market.
The above analyses ignore the tax implications of quarterly rebalancing of funds in the VLSE Index. If holding the index funds in a taxable account, the tax obligations could be materially higher than those for holding SPY.
In summary, while the backtested performance of the Value Line Select ETF Index versus the broad U.S. equity market is promising, the index underperforms during a relatively short out-of-sample test.
SPY may not be the most appropriate benchmark for an equally-weighted portfolio of ETFs that may include non-equity assets.