Are there exploitable long-term cycles in U.S. stock market returns? In the January 2013 update of his paper entitled “Secular Mean Reversion and Long-Run Predictability of the Stock Market”, Valeriy Zakamulin explores mean reversion of the S&P Composite Index over intervals ranging from two to 40 years. He then runs an out-of-sample horse race using inception-to-date data to compare three regression-based models for forecasting long-term stock market returns: (1) mean reversion over the dynamically optimal horizon; (2) the random walk (future mean return equals (evolving) historical mean return); and, (3) valuation based on Robert Shiller’s cyclically adjusted price-to-earnings ratio (P/E10). Using real (Consumer Price Index-adjusted) S&P Composite Index total annual returns and earnings over the period 1871 through 2011 (141 years), he finds that:
- Based on in-sample autocorrelation analyses over the entire sample period and a 1926-2011 subperiod, the S&P Composite Index exhibits significant mean reversion with a full cycle of 30-34 years (peak-to-trough and trough-to-peak reversion of 15-17 years).
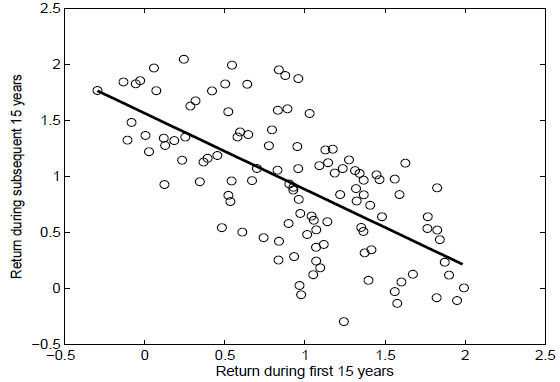
- Over the entire sample period, S&P Composite Index return over the past 15 years explains 42% (R-squared statistic 0.42) of the variation in return over the next 15 years (see the first chart below).
- Out-of-sample tests commencing in 1921 indicate that:
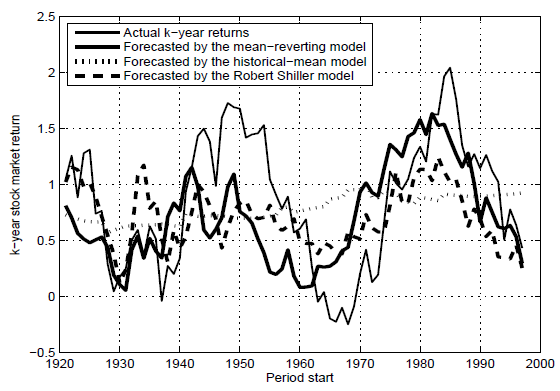
- A stock market model based on mean reversion at the lagged optimal horizon outperforms a model based on the historical mean and performs comparably to a model based on P/E10 valuation (see the second chart below).
- Mean reversion and P/E10 stock market forecasting models perform better during a recent 1959-1997 subperiod than for the overall 1921-1997 out-of-sample test period.
The following chart, taken from the paper, relates future 15-year real return for the S&P Composite Index to its past 15-year real return during 1871-2011 with overlapping intervals. The negative slope indicates mean reversion, with a high (low) past return relating to a low (high) future return. Past returns explain 42% of the variation in future returns. This analysis is in-sample; an investor operating in real time during the sample period would not have all these data. Also, the use of overlapping intervals overstates actual sample size (there are only 9.4 completely independent 15-year intervals in the sample).
The next chart, also from the paper, compares actual returns to forecasted returns for the three-model horse race specified above. Based on correlations between forecasted and actual returns and mean squared prediction errors, mean reversion and P/E10 (Robert Shiller) models perform comparably, both significantly more accurate than the historical mean (random walk) model.
In summary, evidence indicates significant mean reversion of U.S. stock market returns at a horizon (half-cycle) of about 15 years, with the forecasting power of mean reversion similar to the of P/E10.
Cautions regarding findings include:
- The study does not explicitly address the economic value of exploiting mean reversion in U.S. stocks, whether from optimizing the long-term net return from U.S. stocks or from diversifying with asset classes that follow an uncorrelated long-term cycle. In other words, it does not test any trading systems.
- Sample size is not large for this kind of analysis.
See also “Classic Research: Demography and the Stock Market”, “Return-based Analysis of Demographics as Stock Market Predictor” and “Demographic Headwind for U.S. Stock Market?” for potential explanations of a long-term stock market cycle.
“P/E10 and Future Stock Market Returns”, “Predictive Power of P/E10 Worldwide” and “Future Stock Market Returns and P/E10” are also relevant.