Investors ought to reward a company that employs capital productively. One measure of firm productivity is return on invested capital (ROIC), the ratio of operating income to invested capital (debt plus equity minus cash from the balance sheet). Do stocks of high-ROIC firms outperform those of low-ROIC firms? In their June 2007 paper entitled “The Productivity Premium in Equity Returns”, David Brown and Bradford Rowe examine the relationship between ROIC and stock returns for both value stocks and growth stocks. They define value (growth) companies as those with high (low) CTEV, the ratio of invested capital (book value of equity plus debt minus cash) to enterprise value (market value of equity plus debt minus cash). Using monthly stock price data and contemporaneously available accounting fundamentals for the 1,000 largest U.S. companies during 1970-2005, they conclude that:
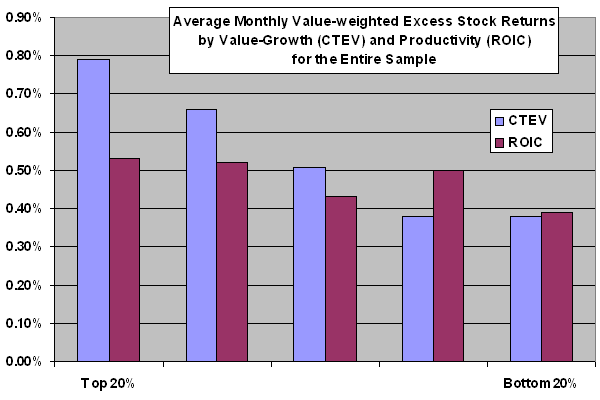
- Productivity relates positively to stock returns. A value-weighted zero-cost portfolio that is long (short) the 20% of stocks with the highest (lowest) productivities produces an average monthly return of 0.47% above the risk-free rate when adjusted for value and size effects. (See the first chart below, which is not adjusted for size and value.)
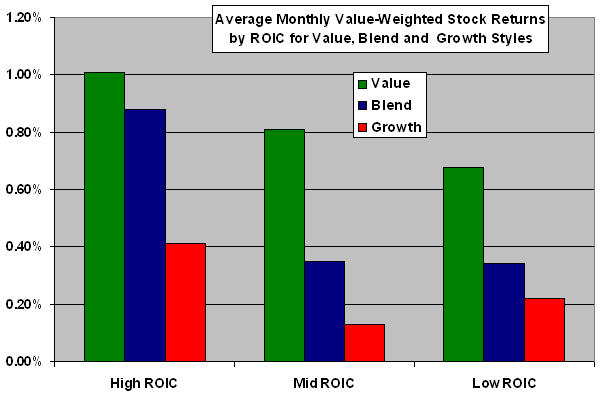
- This productivity effect enhances the performance of value, blend and growth styles. (See the second chart below.)
- The productivity effect holds for individual market sectors. Value-weighted portfolios of firms in the top 20% of productivities by sector outperform those in the bottom 20% of productivities by 4% per year.
- Although investors generally bid the stocks of high-productivity companies into the growth category, the value premium appears to derive from a systematic failure to account for firm productivity fully. Fairly valued firms (growth with high productivity, value with low productivity and mid-range values for both CTEV and ROIC) do not offer abnormal risk-adjusted returns. Overall results suggest that the value premium exists because investors assign high (low) market values to some firms with low (high) productivity, creating a source of negative (positive) abnormal returns. Zero-cost portfolios that are long (short) the 20% of most undervalued (overvalued) stocks, based on independent sorts on CTEV and on ROIC, generate an average monthly excess return of 0.71%.
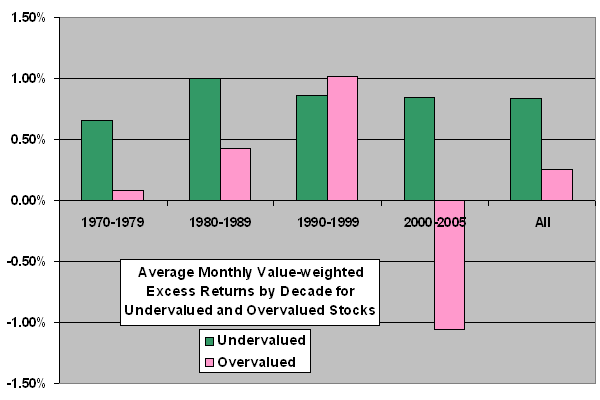
- The outperformance of companies undervalued based on a combination of CTEV and ROIC is fairly persistent across subperiods, although undervalued firms narrowly underperform overvalued firms during the 1990s. (See the third chart below.)
The following chart, constructed from results in the paper, shows the average monthly value-weighted excess stock returns (relative to the risk-free rate) during 1970-2005 for two different cross-sections of the 1,000 largest U.S. firms. One cross-section segments firms by CTEV, a book-to-market ratio encompassing both equity and debt. This cross-section confirms the value premium, with companies in the top 20% (value) roughly doubling the performance of those in the bottom 20% (growth). The other cross-section segments firms by ROIC, a measure of productivity. This second cross-section indicates modest but statistically insignificant outperformance by the top 20% (productive) compared to the bottom 20% (unproductive). Adjusting the ROIC cross-section for value and size effects results in significant outperformance by the stocks of high-productivity firms.
How do productivity and value effects perform when combined?

The next chart, also constructed from results in the paper, shows the average monthly value-weighted excess stock returns (relative to the risk-free rate) during 1970-2005 for two independent sorts of the 1,000 largest U.S. firms, value-growth and productivity. It shows that focusing on high-ROIC companies enhances returns for value, blend and growth investment styles.

The final chart, also constructed from results in the paper, shows the average monthly value-weighted excess stock return (relative to the risk-free rate) by decade during 1970-2005 for undervalued and overvalued segments of the 1,000 largest U.S. firms. Undervalued companies combine mid-to-high CTEV (value orientation) and mid-to-high ROIC (productivity). Overvalued companies combine low-to-mid CTEV with low-to-mid ROIC. The chart shows that undervalued companies generate solid excess returns in all decades, losing (narrowly) to overvalued stocks only during the 1990s. Overvalued stocks lose by substantial margins in all other decades.

In summary, combining a value investing style with a screen for high return on invested capital (productivity) may yield very high-performing portfolios.