A subscriber proposed a simple test of the concept underlying the First Trust Dorsey Wright Focus 5 ETF (FV). This exchange-traded fund (ETF) intends to track the Dorsey Wright Focus Five Index, an equally weighted and weekly reformed portfolio of the five First Trust sector and industry ETFs with the highest price momentum according to the Dorsey, Wright & Associates relative strength ranking system. In the absence of a detailed specification for this ranking system, the subscriber proposed a conceptual test applying the rules for the “Simple Asset Class ETF Momentum Strategy” to the FV universe, which consists of the following 23 ETFs:
First Trust NASDAQ-100-Technology Sector Index Fund (QTEC))
First Trust NYSE Arca Biotechnology Index Fund (FBT)
First Trust Dow Jones Internet Index Fund (FDN)
First Trust ISE-Revere Natural Gas Index Fund (FCG)
First Trust ISE Water Index Fund (FIW)
First Trust S&P REIT Index Fund (FRI)
First Trust Consumer Discretionary AlphaDEX Fund (FXD)
First Trust Consumer Staples AlphaDEX Fund (FXG)
First Trust Health Care AlphaDEX Fund (FXH)
First Trust Technology AlphaDEX Fund (FXL)
First Trust Energy AlphaDEX Fund (FXN)
First Trust Financials AlphaDEX Fund (FXO)
First Trust Industrials/Producer Durables AlphaDEX Fund (FXR)
First Trust Utilities AlphaDEX Fund (FXU)
First Trust Materials AlphaDEX Fund (FXZ)
First Trust FTSE EPRA/NAREIT Developed Markets Real Estate Index Fund (FFR)
First Trust NASDAQ ABA Community Bank Index Fund (QABA)
First Trust NASDAQ Clean Edge Smart Grid Infrastructure Index Fund (GRID)
First Trust ISE Global Copper Index Fund (CU)
First Trust ISE Global Platinum Index Fund (PLTM)
First Trust NASDAQ CEA Smartphone Index Fund (FONE)
First Trust ISE Cloud Computing Index Fund (SKYY)
First Trust NASDAQ Technology Dividend Index Fund (TDIV)
At the end of each month, we allocate all funds to the equally weighted set of the five of these 23 ETFs with the highest total return over the past five months. Using monthly dividend-adjusted closing prices for these ETFs during May 2007 (when 15 of the ETFs are available) through August 2014 (88 months), we find that:
Note that number of ETFs in competition increases over time, as follows:
- The first 15 ETFs are available over the entire sample period.
- FFR is available starting August 2007.
- QABA is available starting July 2009.
- GRID is available starting November 2009.
- CU and PLTM are available starting March 2010.
- FONE is available starting February 2011.
- SKYY is available starting July 2011.
- GRID is available starting August 2012.
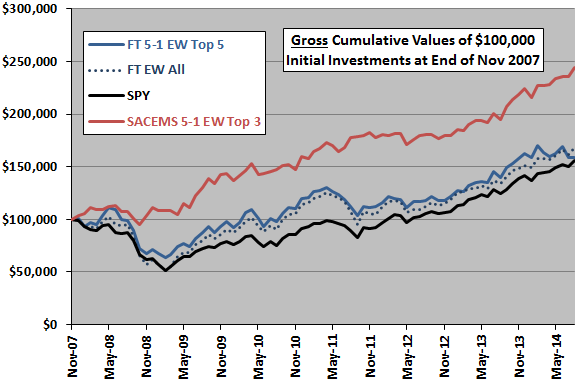
The following chart tracks the gross cumulative values of $100,000 initial investments in the following four strategies:
- FT 5-1 EW Top 5 – the strategy described above, each month reforming an equally weighted (EW) portfolio of the five First Trust sector and industry ETFs (FT) with the highest total returns over the past five months.
- FT EW All – the equally weighted, monthly rebalanced portfolio of all First Trust sector and industry ETFs as available.
- SPY – buy and hold the SPDR S&P 500 ETF (SPY).
- SACEMS 5-1 EW Top 3 – the equally weighted, monthly reformed Top 3 portfolio for the Simple Asset Class ETF Momentum Strategy (SACEMS) described in “Momentum Strategy”.
Calculations derive from the following assumptions:
- Reallocate/rebalance at the close on the last trading day of each month (assume that total five-month past returns for the ETFs can be calculated just before the close).
- Monthly rebalancing of all portfolios is frictionless.
- Ignore any tax implications of trading.
Results suggest that:
- The FT 5-1 EW Top 5 strategy offers some drawdown protection during the equity market crash in 2008-2009, but the First Trust sector and industry ETF universe is too equity-like in aggregate to enable the strategy to avoid most of the crash.
- The momentum screen offers little or no boost to the average performance of ETFs in the universe. In other words, picking and equally weighting five of the First Trust sector and industry ETFs at random each month would likely perform about as well as picking the top five based on past five-month return.
Assuming that trading frictions per ETF are roughly equal, FT 5-1 EW Top 5 would likely be somewhat more costly to maintain than SACEMS 5-1 EW Top 3 but less costly than FT EW All.
As an additional test of the value of momentum ranking for the FT 5-1 EW Top 5 strategy, we look at ETF performance by rank.
The next chart summarizes average monthly gross returns of all 23 ranks of First Trust sector and industry ETFs over the entire sample period. Results do not support a belief that the top five performers outperform lower ranks. In fact, a linear trend line slopes up from left to right. Nor does it appear that portfolios of top ETFs smaller than five would alleviate lack of diversification across asset classes.
Note that all 23 ranks are not populated over the entire sample period per the ETF availability dates listed above.
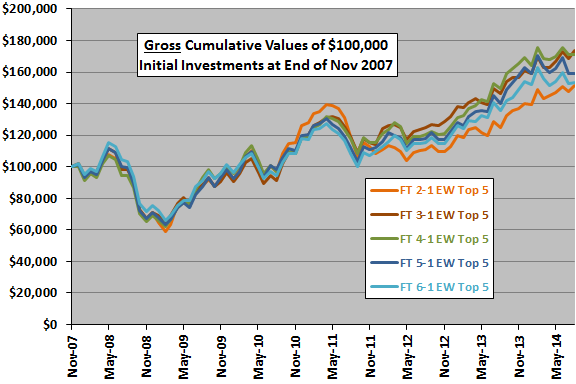
Is FT 5-1 EW Top 5 strategy performance sensitive to the length of the momentum ranking interval?
![]()
The next chart shows the sensitivity of a general FT X-1 EW Top 5, where X is the momentum ranking interval ranging from the last two months to the last six months. Results indicate that:
- Gross outcome is not very sensitive to the length of the ranking interval.
- Different ranking intervals are optimal on a gross basis in different subperiods.
- The gross terminal value of FT 5-1 EW Top 5 is about middle of the pack.
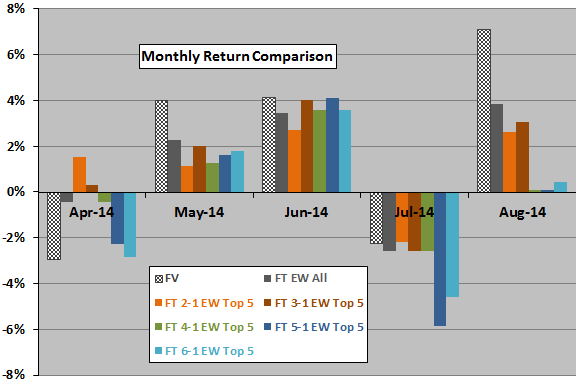
How well does the conceptual test match actual FV returns?
The final chart compares monthly returns for FV since inception to monthly gross returns for FT EW All and the five variations of FT X-1 EW Top 5 considered above. FT EW All has the highest correlation of monthly returns with FV (0.90), but a sample of only five months is much to short to support reliable inference.
In summary, evidence from a limited sample period suggests that: (1) the universe of the First Trust sector and industry ETFs is too narrow asset class-wise to enable side-stepping of equity market crashes via simple relative strength screening; and, (2) simple relative strength screening is not very effective for this set of ETFs.
Cautions regarding findings include:
- Sample size is small (about 18 independent five-month momentum ranking intervals for most of the ETFs and fewer for several others).
- As noted, return calculations are gross, and trading frictions would vary across strategies considered. Net findings may therefore differ from gross findings depending on turnover, bid-ask spreads and account size.
- The Dorsey, Wright & Associates relative strength ranking system may be materially different from any of the simple momentum ranking strategy variations considered above.
- Testing of many strategies/strategy variations on the same set of data introduces data snooping bias, such that the best strategy likely overstates expectations.
- As noted, the available history for FV is far too short to support reverse-engineering of the underlying ETF ranking approach.
Overall, the above results are more like those for the “Simple Sector ETF Momentum Strategy” than for the “Simple Asset Class ETF Momentum Strategy”.