A subscriber requested, as in “Combine Market Trend and Economic Trend Signals?”, testing of a strategy that combines: (1) U.S. Economic Policy Uncertainty (EPU) Index, as described and tested separately in “Economic Policy Uncertainty and the Stock Market”; and, (2) U.S. stock market trend. We consider two such combinations. The first combines:
- 10-month simple moving average (SMA10) for the broad U.S. stock market as proxied by the S&P 500 Index. The trend is bullish (bearish) when the index is above (below) its SMA10 at the end of last month.
- Sign of the change in EPU Index last month. A positive (negative) sign is bearish (bullish).
The second combines:
- SMA10 for the S&P 500 Index as above.
- 12-month simple moving average (SMA12) for the EPU Index. The trend is bullish (bearish) when the EPU Index is below (above) its SMA12 at the end of last month.
We consider alternative timing strategies that hold SPDR S&P 500 (SPY) when: the S&P 500 Index SMA10 is bullish; the EPU Index indicator is bullish; either indicator for a combination is bullish; or, both indicators for a combination are bullish. When not in SPY, we use the 3-month U.S. Treasury bill (T-bill) yield as the return on cash, with 0.1% switching frictions. We assume all indicators for a given month can be accurately estimated for signal execution at the market close the same month. We compute average net monthly return, standard deviation of monthly returns, net monthly Sharpe ratio (with monthly T-bill yield as the risk-free rate), net compound annual growth rate (CAGR) and maximum drawdown (MaxDD) as key strategy performance metrics. We calculate the number of switches for each scenario to indicate sensitivities to switching frictions and taxes. Using monthly values for the EPU Index, the S&P 500 Index, SPY and T-bill yield during January 1993 (inception of SPY) through September 2020, we find that:
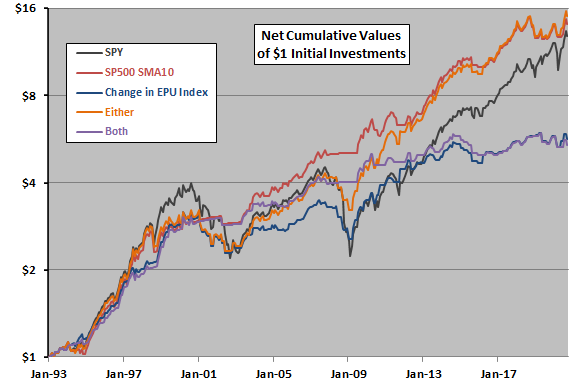
The following chart compares on a logarithmic scale net cumulative values of $1 initial investments over the full sample period in each of:
- SPY – buy and hold SPY
- SP500 SMA10 – hold SPY (T-bills) when the S&P 500 Index SMA10 signal at the end of last month is bullish (bearish).
- Change in EPU – hold SPY (T-bills) when the sign of the change in the EPU Index last month is bullish (bearish).
- Either – hold SPY (T-bills) when either of scenarios 2 and 3 holds SPY (otherwise). In other words, at least one of the signals is bullish.
- Both – hold SPY (T-bills) when scenarios 2 and 3 agree on holding SPY (otherwise). In other words, both signals are bullish.
Notable findings are:
- SP500 SMA10 appears most attractive overall, with close-to-highest terminal value and better navigation of major bear markets. The Either alternative is also attractive compared to buying and holding SPY.
- The Both alternative avoids drawdowns but sacrifices considerable stock market gain.
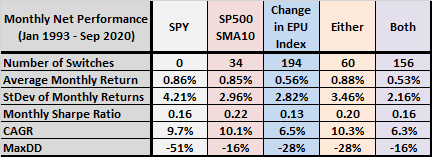
For perspective, we look at key performance statistics.
The following table compares number of SPY-cash switches, average monthly net returns, standard deviations of returns, net monthly Sharpe ratio, net CAGRs and MaxDDs for the above five scenarios. Results indicate that SP500 SMA10 is most attractive overall.
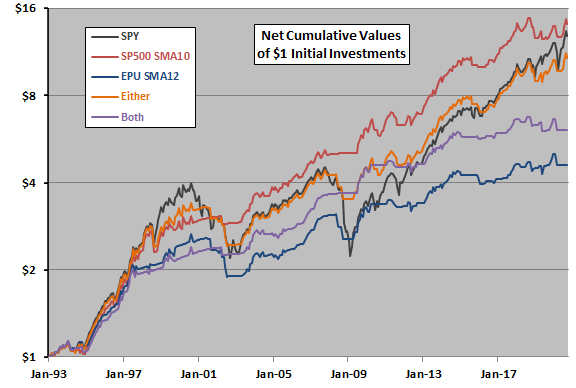
Next we look at the second combination of signals.
The next chart compares on a logarithmic scale net cumulative values of $1 initial investments over the full sample period in each of:
- SPY – buy and hold SPY
- SP500 SMA10 – hold SPY (T-bills) when the S&P 500 Index SMA10 signal at the end of last month is bullish (bearish).
- EPU MA12 – hold SPY (T-bills) when the EPU Index SMA12 signal at the end of last month is bullish (bearish).
- Either – hold SPY (T-bills) when either of scenarios 2 and 3 holds SPY (otherwise). In other words, at least one of the signals is bullish.
- Both – hold SPY (T-bills) when scenarios 2 and 3 agree on holding SPY (otherwise). In other words, both signals are bullish.
Notable findings are:
- SP500 SMA10 offers the best performance, with no close competitor.
- The Either alternative is competitive with buying and holding SPY.
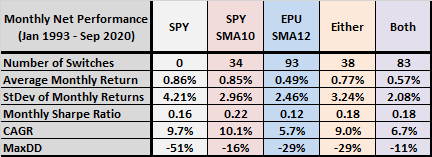
For perspective, we look at key performance statistics.
The following table compares number of SPY-cash switches, average monthly net returns, standard deviations of returns, net monthly Sharpe ratio, net CAGRs and MaxDDs for the above five scenarios. Results confirm that SP500 SMA10 offers the best raw and risk-adjusted performances.
In summary, evidence does not support belief that adding a signal based on the EPU Index improves performance of the S&P 500 Index SMA10 for U.S. stock market timing.
Cautions regarding findings include:
- Cautions in “Economic Policy Uncertainty and the Stock Market” generally apply.
- Testing multiple alternative strategies on the same data introduces data snooping bias, such that the best performance overstates expectations. This caution encompasses not only alternatives within a single study but also those in related studies.