How does news flow interact with short-term stock market return? In their April 2019 paper entitled “Forecasting the Equity Premium: Mind the News!”, Philipp Adämmer and Rainer Schüssler test the ability of a machine learning algorithm, the correlated topic model (CTM), to predict the monthly U.S. equity premium based on information in news articles. Their news inputs consist of about 700,000 articles from the New York Times and the Washington Post during June 1980 through December 2018, with early data used for learning and model calibration and data since January 1999 used for out-of-sample testing. They measure the U.S. stock market equity premium as S&P 500 Index return minus the risk-free rate. Specifically, they each month:
- Update news time series arbitrarily segmented into 100 topics (with robustness checks for 75, 125 and 150 topics).
- Execute a linear regression to predict the equity premium for each of the 100 topical news flows.
- Calculate an average prediction across the 100 regressions.
- Update a model (CTMSw) that switches between the best individual topic prediction and the average of 100 predictions, combining the flexibility of model selection with the robustness of model averaging.
They use the inception-to-date (expanding window) average historical equity premium as a benchmark. They include mean-variance optimal portfolio tests that each month allocate to the stock market and the risk-free rate based on either the news model or the historical average equity premium prediction, with the equity return variance computed from either 21-day rolling windows of daily returns or an expanding window of monthly returns. They constrain the equity allocation for this portfolio between 50% short and 150% long, with 0.5% trading frictions. Using the specified news inputs and monthly excess return for the S&P 500 Index during June 1980 through December 2018, they find that:
- The CTMSw model offers an out-of-sample R-squared improvement of 0.065 compared to the historical average benchmark in explaining monthly equity premium, compared to improvements of 0.024 for the best individual topic predictor and just 0.008 for the average.
- Information from the CTMSw model is distinct from that captured by monthly dividend yield, earnings-price-ratio, dividend payout ratio, return variance, book-to-market ratio, net equity issuance, U.S. Treasury bill yield, long-term U.S. Treasury bond yield, return on long-term U.S. Treasury bonds, default spreads, inflation, term spread and dividend-price ratio.
- Out-of-sample net annualized Sharpe ratios for the mean-variance optimal test portfolios specified above are (see the chart below):
- 0.73 (0.72) for CTMSw with rolling (expanding) window estimation of return variance.
- 0.47 (0.29) for expanding window historical average equity premium with rolling (expanding) window estimation of return variance.
- 0.46 for buy-and-hold.
- An even more flexible version of CTM that allows averaging of predictions for just the best topics rather than all topics generates net annualized Sharpe ratio 0.80.
- CTMSw outperformance concentrates during months when market excess returns are negative.
- Detailed analysis suggests that geopolitical news (especially involving Russia, China or Israel) has greater impact on next-month equity premium than economic news.
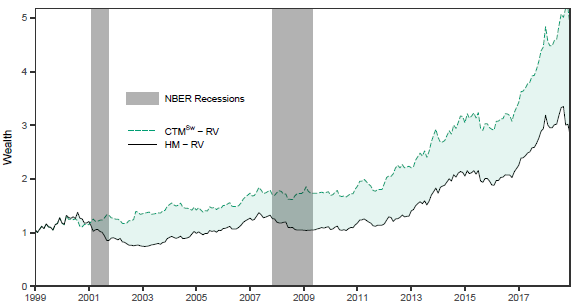
The following chart, extracted from the paper, compares evolutions of net wealth for mean-variance optimization of a portfolio consisting of the S&P 500 Index and the risk-free rate as specified above based on:
CTMSw – RV: allocations based on the CTM news model that switches between the best individual topic prediction and the average prediction of all 100 topics, with equity return variance calculated from daily excess returns over the last 21 trading days.
HM – RV: allocations based on the expanding window historical mean equity premium, with equity return variance calculated from daily excess returns over the last 21 trading days.
The chart also indicates NBER economic recessions. Results indicate that the former outperforms the latter, with outperformance concentrated during recessions.

In summary, evidence suggests that the flow of news, especially geopolitical news, materially predicts the U.S. equity risk premium at a monthly horizon.
Cautions regarding findings include:
- The ability to process news as described did not exist during much of the sample period. In other words, an investor operating in real time could not have exploited news flow in this way. With the capability now in existence, the market may adapt to its use and suppress observed outperformance.
- Testing multiple models/model variations on the same sample introduces data snooping bias, such that the best-performing model overstates expectations. Reliance on prior research for devising models and tests may import additional snooping bias.
- Analysis of news as described is beyond the reach of most investors, who would bear fees for delegating the work to an expert with the appropriate software and data.