Do differences in expectations between institutional and individual investors in stocks and bonds, as quantified in weekly legacy Commitments of Traders (COT) reports, offer exploitable timing signals? In the February 2019 revision of his paper entitled “Want Smart Beta? Follow the Smart Money: Market and Factor Timing Using Relative Sentiment”, flagged by a subscriber, Raymond Micaletti tests a U.S. stock market-U.S. bond market timing strategy based on an indicator derived from aggregate equity and Treasuries positions of institutional investors (COT Commercials) relative to individual investors (COT Non-reportables). This Smart Money Indicator (SMI) has three relative sentiment components, each quantified weekly based on differences in z-scores between standalone institutional and individual net COT positions, with z-scores calculated over a specified lookback interval:
- Maximum weekly relative sentiment for the S&P 500 Index over a second specified lookback interval.
- Negative weekly minimum relative sentiment in the 30-Year U.S. Treasury bond over this second lookback interval.
- Difference between weekly maximum relative sentiments in the 10-Year U.S. Treasury note and 30-year U.S. Treasury bond over this second lookback interval.
Final SMI is the sum of these components minus median SMI over the second specified lookback interval. He considers z-score calculation lookback intervals of 39, 52, 65, 78, 91 and 104 weeks and maximum/minimum relative sentiment lookback intervals of one to 13 weeks (78 lookback interval combinations). For baseline results, he splices futures-only COT data through March 14, 1995 with futures-and-options COT starting March 21, 1995. To account for changing COT reporting delays, he imposes a baseline one-week lag for using COT data in predictions. He focuses on the ability of SMI to predict the market factor, but also looks at its ability to enhance: (1) intrinsic (time series or absolute) market factor momentum; and, (2) returns for size, value, momentum, profitability, investment, long-term reversion, short-term reversal, low volatility and quality equity factors. Finally, he compares to several benchmarks the performance of an implementable strategy that invests in the broad U.S. stock market (U.S. Aggregate Bond Total Return Index) when a group of SMI substrategies “vote” positively (negatively). Using weekly legacy COT reports and daily returns for the specified factors/indexes during October 1992 through December 2017, he finds that:
- When SMI is positive (institutions are relatively bullish on equities), annualized equity market returns are typically 20% higher, with lower volatility, than when SMI is negative (institutions are relatively bearish on equities). Specifically:
- 75 of 78 lookback interval combinations have differences in annualized returns over 10%.
- 49 of 78 have differences over 20%, which is the average across all 78 combinations.
- SMI generally works better for shorter z-score calculation and maximum/minimum relative sentiment lookback intervals.
- The SMI effect holds in both first and second halves of the sample and when market factor time series momentum is either positive or negative (but is much stronger for negative momentum). When market factor momentum is negative, the typical difference in annualized equity market returns between positive and negative SMI conditions is typically 50%.
- The SMI effect passes stringent data snooping tests and is robust to different lookback interval combinations, data lags and methods of constructing the indicator.
- The size and short-term reversal equity factors do better when SMI is positive. The value, profitability, investment, long-term reversion, low volatility and quality factors do better when SMI is negative. SMI has no effect on the momentum factor.
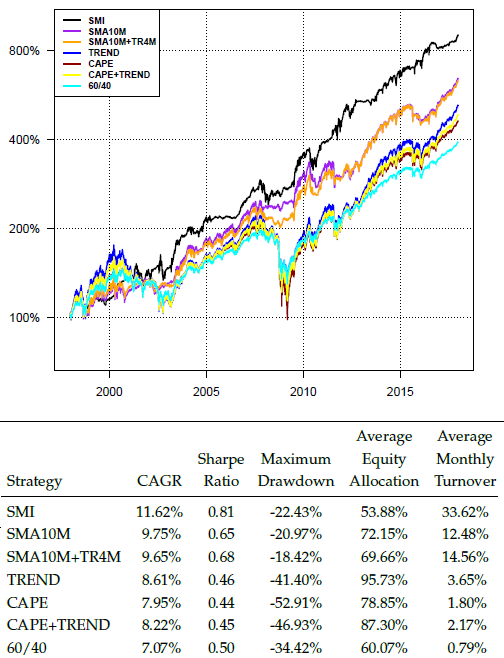
- The implementable stock market-bond switching strategy based on a “vote” of SMI substrategies beats several passive and active benchmarks, generating higher absolute and risk-adjusted returns, with lower exposure to equities (see the chart and table below).
The following chart and table, extracted from the paper, summarize net performance, with modeled portfolio maintenance frictions, of the implementable SMI stocks-bonds switching strategy and compares results to those for the following benchmark strategies:
- SMA10M – 100% in stocks (bonds) when the stock market is above (below) its 10-month simple moving average (SMA).
- SMA10M+TR4M – 100% in stocks (bonds) when the stock market is above (below) its 10-month SMA and its 4-month total return is positive (negative), and 50% in stocks and 50% in bonds when these signals conflict.
- CAPE – based on the Cyclically-Adjusted Price to Earnings (CAPE, or P/E10).
- TREND – based on a 12-month stock market trend indicator.
- CAPE+TREND: a combination strategy with stock market allocation between 50% and 150%, holding bonds when the stock market allocation is less than 100%.
- 60/40 – 60% allocation to stocks and 40% to bonds, rebalanced quarterly.
Key performance metrics are compound annual growth rate (CAGR), annual Sharpe ratio, maximum drawdown, average equity allocation and average monthly portfolio turnover. Results show that the SMI-based strategy outperforms other strategies on most metrics, but is more sensitive to portfolio maintenance frictions due to much higher turnover.
In summary, evidence indicates that the sign of SMI successfully exploits a market forecasting advantage of institutional investors compared to individual investors over intervals during which institutions likely apply that advantage.
Cautions regarding findings include:
- Investors may not be able to achieve all assumed (low) levels of implementation frictions.
- The sample period, with generally falling interest rates, is largely a bull market for bonds. Performance of SMI signalling, with a relatively high average allocation to bonds, may not be as strong compared to benchmarks when interest rates rise.
- In the implementable strategy test, a lower exposure to equities means a higher exposure to bonds (which may have considerable volatility/risk).
- The strategy seems sufficiently complex for investors to ask for live testing for verification.
For other research using COT reports, see “Using Commitments of Traders Reports to Time Asset Allocations” and “Net Speculators Position as Futures Return Predictor”.