A reader inquired about the COTs Timer trading system, which employs information from the Commodity Futures Trading Commission’s (CFTC) combined futures and options Commitments of Traders (COT) reports to time the markets for associated assets. In describing these reports, COTs Timer states that: “Devoted fans say they may be the closest thing in the public domain to a Holy Grail of market forecasting.” The author (Alex Roslin, a journalist) outlines nine steps that take ten minutes each week to exploit COT report data and states: “I’ve been using my COTs-based system to invest my family’s savings since January 2007.” He presents the long-term performance of his system across asset classes and offers detailed weekly data and analysis, including buy and sell signals, for S&P 500 index COT reports dating back to 5/16/95. Using these signals and contemporaneous weekly opening levels for the S&P 500 index over the period 6/12/95 through 2/25/08 (663 weeks), we find that…
According to the system performance notes, the S&P 500 index “setup buys the index when the commercial trader net futures and options position as a percentage-of-open-interest is -1 [standard deviation] or less from its nine-week moving average and sells the index when the net position is at -1 [standard deviation] or greater from the moving average.” We accept those calculations as they are and apply the following assumptions and rules to calculate returns for the COTs Timer strategy for the S&P 500 index:
- Since the signals are based on S&P 500 index futures and options, we use the S&P 500 index for return calculations, even though the underlying is not precisely investable.
- Since the long-term performance summary indicates a three-week delay (corrected from an erroneous one-week delay used in the original 4/18/08 analysis) in implementing S&P 500 index signals, we assume action on new COTs Timer buy and sell signals at the open three weeks after CFTC releases a report. For example, there is a new signal based on the report dated Tuesday, 5/16/95. The CFTC releases this report on Friday, 5/19/95. We assume execution of the signal at the open on 6/12/95, which is three weeks from the Monday after 5/19/95.
- We hold the COTs Timer strategy long or short per the last executed signal until the signal changes.
- We treat the return from 9/10/01-9/24/01 as a single week because of the intervening stock market closure (there is no change in signal around this time).
- When the COTs Timer strategy is long (short) during a week, we credit the strategy with the weekly return (minus the weekly return) of the S&P 500 index.
- We perform calculations with and without a 0.2% trading friction per one-way trade. Actual trading friction depends on broker fees and trade size.
- We do not incorporate stop losses (which might cut some losses but might also disrupt the flow of subsequent signal execution).
- We use a buy-and-hold strategy for the S&P 500 index as a benchmark.
These assumptions generate 150 trades for the COTs Timer S&P 500 index strategy over the entire sample period, roughly one per month. The average weekly return for the COTs Timer strategy without (with) trading friction is 0.36% (0.31%), substantially greater than the 0.17% for a buy-and-hold strategy.
To examine compounded performance, we calculate cumulative returns.
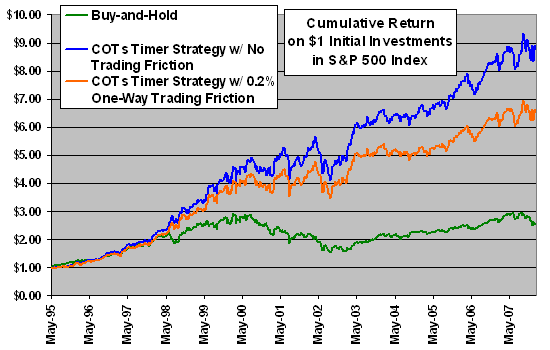
The following chart compares cumulative returns for $1.00 initial investments on 6/12/95 in the COTs Timer strategy (with and without an assumed trading friction of 0.2% per one-way trade) and the buy-and-hold strategy over the entire sample period. The COTs Timer strategy clearly outperforms over the 12+ years sampled.
For another perspective, we calculate returns by calendar year.
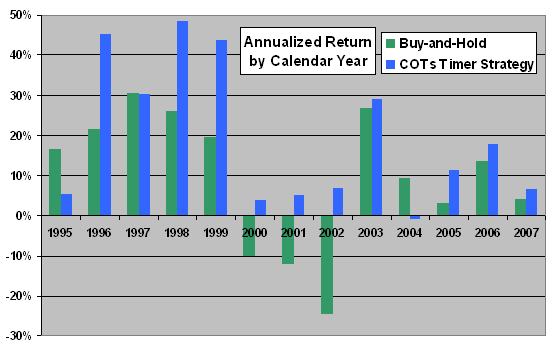
The next chart compares the annualized returns of the COTs Timer strategy for the S&P 500 index (with no trading friction) and a buy-and-hold strategy during 1995-2007. Results for 1995 are based on only 31 weeks. We do not include results for 2008 since the sample includes just eight weeks from 2008. The average (arithmetic mean) annualized return for the COTs Timer strategy is an impressive 19.4%, compared to 9.5% for buy-and-hold. The standard deviation of annualized returns is 17.6% for the COTs Timer strategy and 16.8% for buy-and-hold. The COTs Timer strategy beats the buy-and-hold strategy in 10 of 13 years. A simple risk-adjusted view clearly favors the COTs Timer strategy.
Most of the outperformance of the COTs Timer strategy appears to come from 1996-2002. We next check the robustness of the COTs Timer strategy since the beginning of 2003.
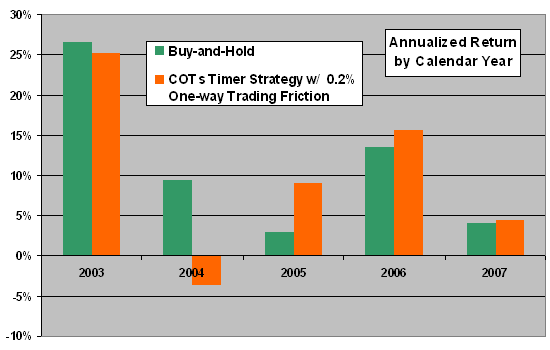
The next chart compares the annualized returns of the COTs Timer strategy for the S&P 500 index (with an assumed trading friction of 0.2% per one-way trade) and a buy-and-hold strategy during 2003-2007 (269 weeks involving 62 trades). The average annualized return for the COTs Timer strategy with friction is an 10.1%, compared to 11.3% for buy-and-hold. The COTs Timer strategy beats the buy-and-hold strategy in three of five years.
How do cumulative returns over the past five years compare?
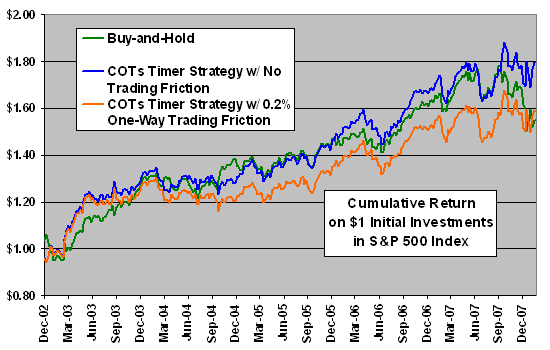
The next chart compares cumulative returns of $1.00 initial investments on 12/30/02 in the COTs Timer strategy for the S&P 500 index (with and without an assumed trading friction of 0.2% per one-way trade) and the buy-and-hold strategy during 12/30/02 through 2/25/08. The COTs Timer strategy without trading friction matches or slightly outperforms a buy-and-hold strategy over the recent five-year subsample. The COTs Timer strategy with trading friction mostly lags buy-and-hold.
How does the performance of the COTs Timer strategy compare while long and while short?
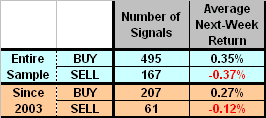
The following table summarizes the frequency with which the COTs Timer strategy for the S&P 500 index is long (short) and the corresponding behavior of the S&P 500 index over both the entire sample period and a recent subsample. The strategy is long about 75% of the time. Over the entire sample period, the average weekly return during executed BUY (SELL) signals is 0.35% (-0.37%), compared to 0.17% for all days in the sample. During the recent subsample, , the average weekly return during executed BUY (SELL) signals is 0.27% (-0.12%), compared to 0.18% for all days in the subsample. These results indicate good timing results over the entire sample, but less impressive performance recently.
How sensitive are the results of the COTs Timer strategy to the delay between signal and trade execution?
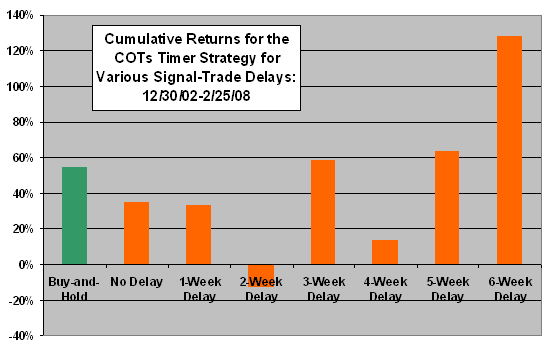
The next chart compares final cumulative returns of initial investments on 12/30/02 in the COTs Timer strategy for the S&P 500 index (with an assumed trading friction of 0.2% per one-way trade) for signal-trade delays ranging from zero weeks to six weeks. Returns range from -13% for a two-week delay to 128% for a six-week delay. The baseline three-week delay generates a return of 59%. The lack of systematic variation in return with length of signal-trade delay suggests random variation rather than underlying market positioning processes. In practical terms, final returns are sensitive to including or excluding just a few trading weeks at the beginning and end of the subsample (both periods of high market return volatility).
For comparison, the chart includes the final cumulative return for a contemporaneous investment using a buy-and-hold strategy 55%.
Regarding stated long-term total returns by asset class, the accompanying notes disclaim: “This is the theoretical return from buying the security on a buy signal and shorting it on a sell signal. The return doesn’t include commissions, slippage or other costs.” Two potential issues with relying on these results are:
- As illustrated above, trading friction/costs can be economically important when a system involves many trades.
- The discussion of the COTs Timer system indicates that development involved selecting the best from among many tested trading thresholds, implementation delays and holding periods. This approach introduces data mining bias (a luck factor), meaning that out-of-sample trading would likely underperform exceptionally strong backtested returns. Nearly all the COTS Timer strategy S&P 500 index signals are outputs of backtesting.
Note also that, because the signal specification uses a nine-week moving average, effective sample size (based on completely independent input data) is only 74 intervals (663 weeks divided by nine weeks) for the entire sample period and 30 intervals (269 weeks divided by nine weeks) for the recent subsample. Small samples limit inferential confidence-building and help explain why seemingly modest variations in a parameter (such as signal-trade delay) can cause big changes in outcomes.
In summary, testing indicates that the COTs Timer trading system for the S&P 500 index as presently specified exhibited strong outperformance during 1996-2002, but not over the last five years.
Comments from COTs Timer strategy developer Alex Roslin on 4/22/08 and 4/23/08:
Comment 1: While you raise a good point about trade friction, which I am integrating into an ongoing refinement of my trading strategy, you say the performance of the COTS Timer S&P 500 index setup with trade friction mostly lags buying and holding the index in the last five years. You evaluate this by studying only the profit. That’s probably the weakest measure you can use. It is easy to find incredibly profitable trading setups that aren’t very statistically robust by other measures. One more robust measure to use, for example, is the Sharpe ratio, which indicates whether the return was achieved at the expense of great volatility. The 2003-07 Sharpe score for this setup is 2.8, while for buying and holding it is 2.0. The large difference suggests the setup achieves the same return with less tough-to-stomach ups and downs. Over the entire 1995-2007 period, the Sharpe for the setup is 3.4, while for SPX it was 1.2. The Sharpe ratio is one measure that is far more robust than your evaluation method based on profit. Profit alone is far worse than Sharpe. In my setup evaluations, I also use the Student’s t-test, Regressed Annual Return (slope of the best-fit line), Robust Sharpe (which uses the Regressed Annual Return in the numerator), and out-of-sample testing. Each one has its weaknesses, but combining them all tends to point reliably to the top setups from among the thousands I review.
Response 1: Validly constructed long-run out-of-sample tests and, even more so, long-run live tests of the economic value of a trading strategy are most convincing.
Comment 2: You also say the COTs Timer dataset for the S&P 500 index has a small sample size that reduces confidence in the setup. Your conclusion does not seem to be based on anything very solid. I invite you to read up on how to determine this question by reading Robert Pardo’s new book on trading strategy development. One way of checking the sample size is the number of trades. This setup has 150. That is well over the 30 minimum trades Pardo recommends for a reliable setup. In his book, you will also see a simple method described to evaluate if you have enough data for your strategy. I blogged about this here. Using this method, this setup’s nine-week moving average period uses only 3% of the available degrees of freedom of the dataset (based on the 12 trading rules in the strategy). That is well below the 10% maximum suggested by Pardo. By that method, this setup using a nine-week moving average is well within the acceptable range, contrary to your claim in your post. Pardo outlines other methods of reducing the risk of data-mining, which I have implemented or am in the process of implementing. One is out-of-sample testing. This particular setup achieves an out-of-sample efficiency of 1.3 in 10 tests – meaning on average the out-of-sample performance was 30% higher than for the in-sample data for Sharpe, Robust Sharpe, compound annual growth rate, drawdown and regressed annual return.
Response 2: The number of trades itself is not a good way to characterize independent sample size unless the trade signals derive from independent intervals of source data. See also David Aronson’s Evidence-Based Technical Analysis: Applying the Scientific Method and Statistical Inference to Trading Signals. Nowhere in the above review do we state that the sample sizes are outside “the acceptable range.” We state that “small samples limit inferential confidence-building and help explain why seemingly modest variations in a parameter (such as signal-trade delay) can cause big changes in outcomes” (as shown in the final chart). Conversely, it is difficult to understand how one-week changes in the signal-trade delay could cause such wild and unsystematic changes in cumulative return outcomes unless effective sample size is small or the distribution of weekly returns is substantially non-normal.
Comment 3: You are incorrect to conclude that your study confirms that “the predictive power of COT report data may have diminished in recent years.” Your chart of annualized return by calendar year for buying and holding the S&P 500 index and the COTs Timer strategy with trade friction shows that the best performances came at the end of that five-year period in 2005 to 2007. As well, you draw this conclusion based on evaluating one possible setup. Again, I would suggest that is not a very robust conclusion. So I think the jury is still definitely out on whether the COTs data has lost relevance.
Response 3: The outperformance of the COTs Timer strategy for the S&P 500 index is only 3%-8% for 2005-2007 (without trading friction). The best years of outperformance are in 1996, 1998, and 1999-2002, ranging from +14% to +31% (again without trading friction). Clearly, the performance of the strategy is much weaker during 2003-2007 and during 2005-2007 than during those earlier years.
Additional comments from COTs Timer strategy developer Alex Roslin on 4/25/08:
Comment 4: You said your study tends to confirm that COT data has lost some predictive value since 2003, similar to other trading measures after they were published. If the outperformance of this particular trading setup for the SP500 has declined since 2003, I’d think this has more to do with the fact that we have been in a bull market since that time. This is a long-short strategy after all, so since we’ve been in a bullish period most of that time, the fact that this setup still beat the market is of significant research interest especially now that that bull market might be at an end. You might recall that until this point, most researchers had claimed there was very little trader relevance at all in the COT data. As well, your point about the data losing relevance after its publication makes especially little sense because I’ve been using this particular S&P 500 setup only since February 2008, and my blog gets only a few hundred readers a day. How could these signals have affected the market going back to 2003 escapes me because the small number of other COT analysts out there use entirely different approaches to the data. Perhaps only one or two I know of actually trade off the data exclusively.
Response 4: The above analysis does not demonstrate that the COTs Timer strategy for the S&P 500 index has outperformed the index since 2003.
Comment 5: You suggested that varying returns for this setup for the different delayed periods suggest random variation, not underlying market processes. I started testing for trade delays because I noticed it sometimes takes several weeks for extreme trader positioning to impact on the underlying market. In order to see if this effect was actually present in the data, I’ve studied all the tens of thousands of possible setups for each trade-delay period. Contrary to your suggestion, the results show a very systematic progression of results for various trade-delay periods for SPX futures and options. Using this delay, 49.6% of all possible setups have Regressed Annual Return (RAR%) over 0%, and 42% have RAR% greater than 4%, while 47.7% have Compound Annual Growth Rates (CAGR%) over 0% and 33.2% have CAGR% greater than 4%. On either side of the three-week delay period, the results are still good but taper off systematically. This is a strong indication that the three-week delayed setup is not a result of data-mining, but a systematic market effect.
Response 5: The result shown in the final chart above for the current COTs Timer strategy for the S&P 500 index since 2003 does not support a belief that the variation of returns with signal-trade delay is systematic.
As always, we invite readers to consider the disagreements and arguments and decide for themselves what to believe.