Are there plenty of exchange-traded funds (ETF) offering positive or negative exposures to widely accepted factor premiums? In his February 2017 paper entitled “Are Exchange-Traded Funds Harvesting Factor Premiums?”, David Blitz analyzes the exposures of U.S. equity ETFs to market, size, value, momentum and volatility factors. Specifically, he calculates factor betas (exposures) from a multi-factor regression of monthly excess (relative to the risk-free rate) total returns for each ETF versus market, small-minus-big size (SMB), high-minus-low value (HML), winners-minus-losers momentum (WML) and low-minus-high volatility (LV-HV) factor returns during 2011 through 2015. His overall sample consists of 415 U.S. equity ETFs with least 36 months of return history as of the end of 2015. He also considers subsamples consisting of: (1) 103 smart beta ETFs that explicitly target factor premiums, including fundamentally weighted and high-dividend funds; and, (2) the remaining 312 conventional ETFs, including sector funds and funds with conflicting factor exposures. He includes lists of the 10 ETFs with the most positive and the 10 ETFs with the most negative exposures to each factor from among the 100 largest ETFs. Using monthly Assets under Management (AuM) and total returns for the specified 415 ETFs, along with the monthly risk-free rate and the selected factor premiums during January 2011 through December 2015, he finds that:
- For each factor, there are funds with substantial positive exposures and funds with substantial negative exposures. The most extreme exposures are for leveraged and inverse ETFs (comprising less than 2% of aggregate AuM).
- Based on fund counts across all 415 ETFs:
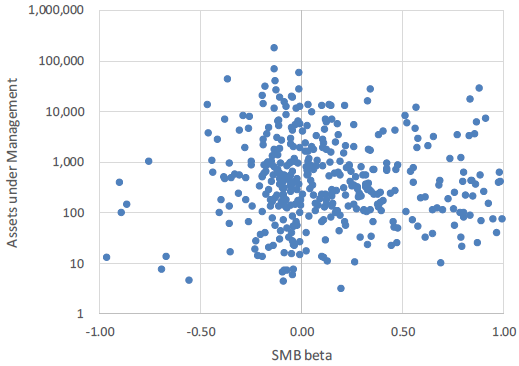
- 32.0% (18.1%) exhibit significantly positive (negative) SMB exposures. (See the scatter plot below.)
- 21.4% (17.3%) exhibit significantly positive (negative) HML exposures.
- 13.0% (10.6%) exhibit significantly positive (negative) WML exposures.
- 19.5% (25.8%) exhibit significantly positive (negative) LV-HV exposures.
- Based on AuM weighting across all 415 ETFs, aggregate exposures to these four factors are close to zero, arguing against belief that factor strategies are overcrowded.
- Within the subsample of 103 smart beta ETFs, aggregate exposures to SMB, HML, WML and LV-HV are all positive, most significantly for SMB and least significantly for WML.
- The subsample of 312 conventional ETFs is in aggregate roughly a mirror image of the smart-beta ETFs, tending to take the other sides of factor trades.
- Among the 100 largest ETFs:
- Seven of the 10 funds with the most positive SMB exposures track small-capitalization stock indexes. There is no pattern among the 10 funds with the most negative SMB exposures.
- Energy and financial (health care and biotechnology) sector ETFs dominate the 10 funds with the most positive (negative) HML exposures. These results reflect large and persistent differences in valuation ratios across sectors.
- Half the funds with the most positive WML exposures are real estate ETFs, and funds with the most negative WML exposures are mostly energy and technology sector ETFs.
- Two large smart beta funds (Powershares S&P Low Volatility Index ETF and iShares Edge MSCI Minimum Volatility US Index ETF) are among the 10 with the most positive LV-HV exposures, along with high-dividend ETFs and utilities and consumer staples sector ETFs. The 10 funds with the most negative LV-HV exposures include biotechnology, energy and technology sector ETFs.
The following chart, taken from the paper, shows the dispersion of funds by SMB beta (restricted to -1 to +1). There are a few leveraged ETFs with lower and higher exposures not shown. The distribution is tilted count-wise toward positive exposures, but the tilt disappears when weighting by AuM.
In summary, evidence indicates that the existing universe of U.S. equity ETFs present opportunities to harvest major equity factor premiums, but do not indicate that factor strategies are crowded.
Cautions regarding findings include:
- The study evaluates how well ETFs track factors premiums during 2011-2015, but it does not assess the potential profitability of factor harvesting.
- Results are a snapshot. The study does not analyze whether factor exposures for a given ETF are stable over time (whether an investor can rely on a given ETF for long-term harvesting of a specific factor premium).
- As noted in the paper, HML, WML and LV-HV factor exposures interact with sector exposures. In other words, a sector-neutral approach (e.g., sorting each sector separately) may be necessary to capture associated premiums consistently.
See “Measuring the Size Effect with Capitalization-based ETFs”, “Measuring the Value Premium with Style ETFs” and “Simple Sector ETF Momentum Strategy Update/Extension” for simple tests of size, value and momentum factor premium harvesting via ETFs.