Should investors strategically diversify across widely known equity market anomalies? In the October 2011 version of his paper entitled “Strategic Allocation to Premiums in the Equity Market”, David Blitz investigates whether investors should treat anomaly portfolios (size, value, momentum and low-volatility) as diversifying asset classes and how they can implement such a strategy. To ensure implementation is practicable, he focuses on long-only, big-cap portfolios. To account for the trading frictions associated with anomaly portfolio maintenance and for time variation of anomaly premiums, he assumes future (expected) market and anomaly premiums lower than historical values, as follows: 3% equity market premium; 0% expected incremental size and low-volatility premiums; and, 1% expected incremental value and momentum premiums. He assumes future volatilities, correlations and market betas as observed in historical data and constrains weights of all anomaly portfolios to a maximum 40%. He considers both equal-weighted and value-weighted individual anomaly portfolios, and both mean-variance optimized and equal-weighted combinations of market and anomaly portfolios. Using portfolios constructed by Kenneth French to quantify equity market/anomaly premiums during July 1963 through December 2009 (consisting of approximately 800 of largest, most liquid U.S. stocks), he finds that:
- Both equal-weighted and value-weighted individual anomaly portfolios exhibit attractive Sharpe ratios and market alphas, with equal-weighted stronger. However, evidence for the size premium is relatively weak.
- Correlations among the market alphas of the anomaly premiums range from -0.45 and 0.64, indicating distinct effects and potential diversification benefits.
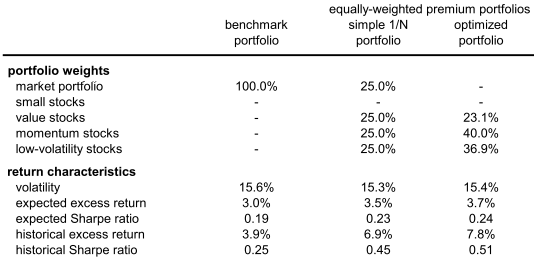
- The mean-variance optimized combination of portfolios makes large allocations to the value, momentum and low-volatility portfolios and none to the market and size portfolios, producing an expected Sharpe ratio 25%-30% higher than that of the market portfolio. The expected Sharpe ratio of the simple equal-weighted combination of market and anomaly portfolios (see the table below) slightly outperforms the mean-variance optimization.
- Efficient risk management indicates allocating to equity premium anomalies by strategic choice rather than tactical adjustment.
The following table, extracted from the paper, compares conservatively estimated future (expected) net and historical performances of the market (benchmark) portfolio, an equal-weighted combination of the market and anomaly portfolios and a mean-variance optimized combination of these five portfolios. Expected return calculations use the assumptions stated above. Historical returns ignore portfolio maintenance (trading) frictions and management fees.
Results show that diversification across equity anomaly portfolios reduces volatility, enhances return in excess of the Treasury bill yield and therefore increases Sharpe ratio compared to the market portfolio.
The paper includes similar, somewhat less attractive, results for value-weighted individual anomaly portfolios.

In summary, evidence indicates that investors may be able to improve risk/return performance in equities by strategically diversifying across reasonably liquid portfolios designed to exploit several conservatively derated stock market anomalies.
Cautions regarding findings include:
- Even the conservatively adjusted estimates of net future anomaly premiums may be optimistic (especially for individuals with modest accounts). Implementation with exchange-traded or mutual funds may produce results different from those estimated with individual stock portfolios.
- As noted, results based on historical data are gross, not net. Including reasonable trading frictions for portfolio maintenance would materially reduce reported returns.