Do stock return anomalies exhibit January and month-of-quarter (first, second or third, excluding January) effects? In his February 2015 paper entitled “Seasonalities in Anomalies”, Vincent Bogousslavsky investigates whether the following 11 widely cited U.S. stock return anomalies exhibit these effects:
- Market capitalization (size) – market capitalization last month.
- Book-to-market – book equity (excluding stocks with negative values) divided by market capitalization last December.
- Gross profitability – revenue minus cost of goods sold divided by total assets.
- Asset growth – Annual change in total assets.
- Accruals – change in working capital minus depreciation, divided by average total assets the last two years.
- Net stock issuance – growth rate of split-adjusted shares outstanding at fiscal year end.
- Change in turnover – difference between turnover last month and average turnover the prior six months.
- Illiquidity – average illiquidity the previous year.
- Idiosyncratic volatility – standard deviation of residuals from regression of daily excess returns on market, size and book-to-market factors.
- Momentum – past six-month return, skipping the last month.
- 12-month effect – average return in month t−k*12, for k = 6, 7, 8, 9, 10.
Each month, he sorts stocks into tenths (deciles) based on each anomaly variable and forms portfolios that are long (short) the decile with the highest (lowest) values of the variable. He updates all accounting inputs annually at the end of June based on data for the previous fiscal year. Using accounting data and monthly returns for a broad sample of U.S. common stocks during January 1964 to December 2013, he finds that:
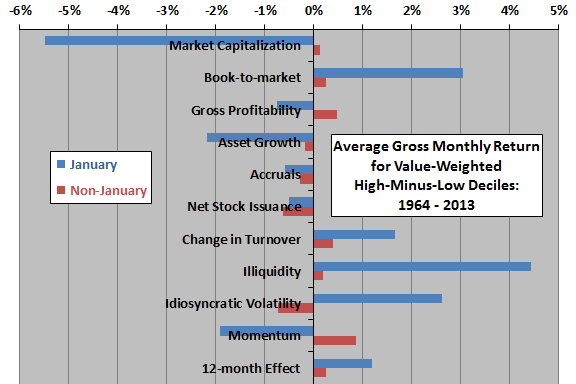
- There are strong January effects for most anomalies (see the first chart below).
- For several anomalies, the long-short portfolio return switches sign in January.
- Past-year returns explain part, but not all, of January returns.
- January effects are generally less pronounced during the second of the sample period than the first half, but most anomalies continue to exhibit seasonality.
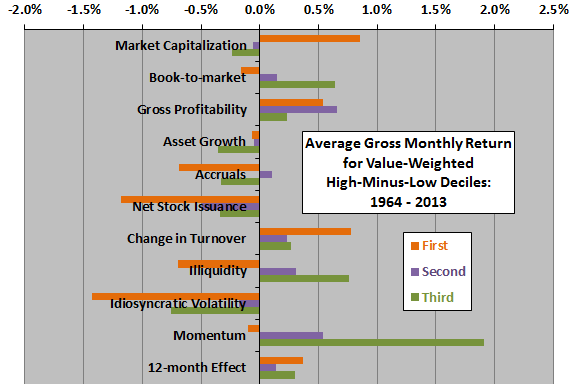
- Almost all anomalies exhibit a first-month-of-the-quarter effect (see the second chart below).
- There is no evidence that this effect derives from expected firm earnings announcements.
- Month-of-the-quarter effects are generally more pronounced during the second of the sample period than the first half.
- The observed seasonalities are not entirely due to small or low-priced stocks.
The following chart, constructed from data in the paper, summarizes average gross monthly returns during January and during other months for value-weighted high-minus-low deciles sorted by each of the anomaly variables specified above. For example, the market capitalization anomaly portfolio is long the biggest stocks and short the smallest. This size effect portfolio generates on average a very negative return during January but a slightly positive return during other months. Results show that average January returns are very different from average returns for other months for many anomalies.
The next chart, also constructed from data in the paper, summarizes average gross monthly returns during the first (excluding January), second and third months of each quarter for value-weighted high-minus-low deciles sorted by each of the anomaly variables specified above. The first month of the quarter is distinctive for several anomalies.
In summary, evidence indicates that several widely accepted U.S. stock return anomalies exhibit January and month-of-the-quarter effects.
Cautions regarding findings include:
- Returns are gross, not net. Accounting for monthly rebalancing frictions and shorting costs would lower these returns. Since these costs may vary across deciles, net findings may differ from gross findings. Moreover, shorting of stocks selected for short sides may not always be feasible.
- Exploiting observed calendar effects would involve additional costs (including tax implications) to enter and exit positions.
- Average monthly return is not sufficient for determining practical investment outcome.