Is the finding in “Expected Stock Market Volatility and the Size Effect” that the size effect concentrates in intervals after months of very high stock market volatility robustly evident from liquid exchange-traded funds (ETF)? To investigate, we define the size effect as the difference in returns between iShares Russell 2000 (IWM) and iShares Russell 1000 (IWB) at a monthly frequency and use the CBOE Volatility Index (VIX) as expected market volatility. To check robustness of cited research, we consider:
- Thresholds for high VIX ranging from above average to two standard deviations above average.
- Out-of-sample identification of high monthly VIX values using either inception-to-date (ITD) or rolling 120-month (Rolling120) historical windows of monthly VIX closes.
- Lags between VIX measurements and size effect returns ranging from zero to two months.
We focus on differences in average monthly IWM-IWB returns, standard deviations of IWM-IWB monthly returns and IWM-IWB monthly reward-to-risk ratio (average return divided by standard deviation of returns) for months after high versus not-high values of VIX. Using monthly levels of VIX during January 1990 (inception) through September 2016 and monthly total returns for IWM and IWB during May 2000 (inception) through September 2016, we find that:
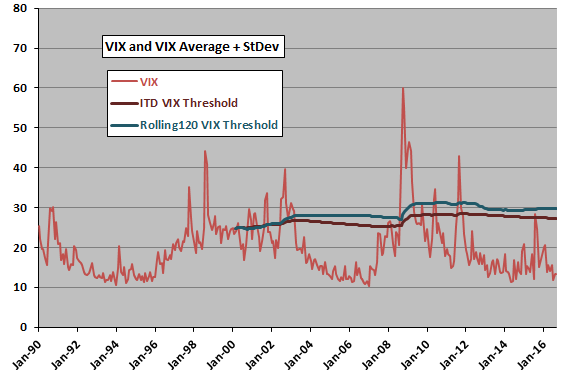
The following chart shows:
- VIX over its available sample period.
- ITD VIX Threshold – the threshold for high values of monthly VIX based on ITD average monthly VIX plus one standard deviation of ITD monthly VIX values, starting in March 2000.
- Rolling120 VIX Threshold – the threshold for high values of monthly VIX based on average monthly VIX over the last 120 months plus one standard deviation of monthly VIX values over the last 120 months, again starting in March 2000.
For these thresholds, VIX based on the ITD (Rolling120) specification is high during 18% (15%) of months since inception of IWM and IWB in May 2000.
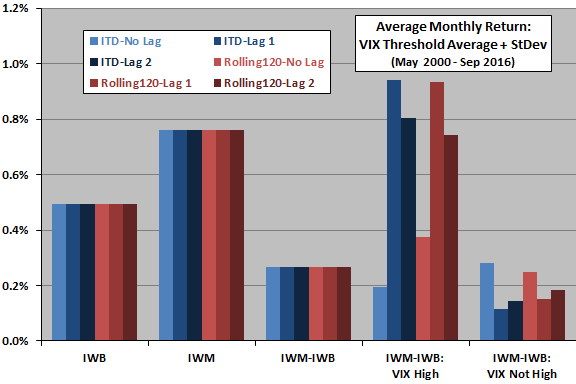
The next chart summarizes average monthly returns for IWB, IWM, the size effect (IWM-IWB) and the size effect after high and not-high values of VIX for six variations derived from:
- One way to define VIX “highness” specified as above past average plus one standard deviation.
- Two methods for applying the definition of VIX “highness” based on either ITD or Rolling120 past monthly values of VIX.
- Three lags between monthly VIX measurement and monthly size effect measurement: 0, 1 or 2 months.
As noted above, for the “highness” specification used, 18% (15%) of monthly VIX values are high for the ITD (Rolling120) calculation methods.
Results suggest that:
- Findings are similar for the ITD and Rolling120 threshold calculation methods.
- Findings are similar for Lag 1 and Lag 2 between VIX and size effect calculations, but there appears to be no relationship between VIX and future size effect for Lag 0. In other words, stale VIX values work better than fresh, and Lag 1 may be optimal.
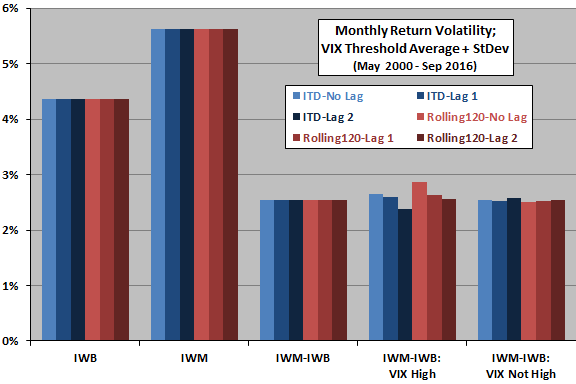
What about return variability?
The next chart summarizes standard deviations of returns for the same setup. Results consistently show that past VIX has little or no effect on size effect variability.
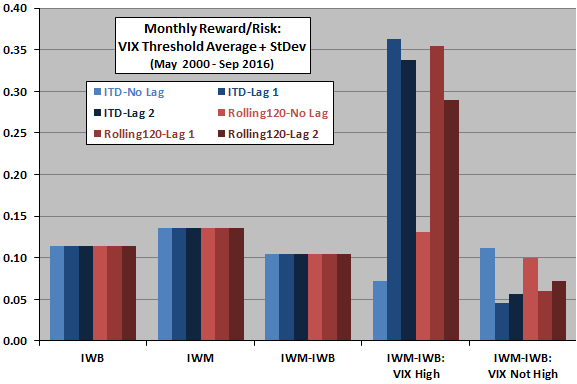
What about reward-to-risk ratio (reward/risk)?
The next chart summarizes monthly reward/risk for the same setup. Findings are very similar to those for average returns. In other words, average return and not return variability drives any reward/risk relationships between VIX and future size effect.
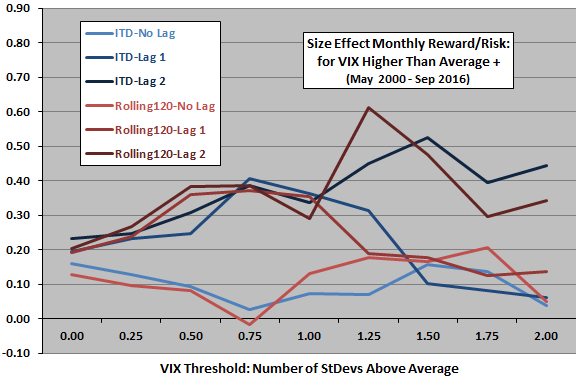
What happens if we change the VIX “highness” specification?
The final chart summarizes monthly reward/risk for the size effect after high VIX for the same six variations across a range of VIX “highness” specifications, ranging from greater than past average to greater than past average plus two standard deviations of past values. Results suggest that:
- As found about ITD and Rolling120 variations work similarly.
- There is no relationship between VIX and future size effect for Lag 0.
- The optimal VIX “highness” range for Lag 1 is around 0.75-1.00 standard deviations above average. Lag 1 does not work well for higher thresholds, undermining confidence in the relationship.
- Lag 2 works mostly consistently across the VIX “highness” range and is optimal for high thresholds.
The superiority of staler VIX data (Lag 2) perhaps undermines belief in theoretical explanations based on market risk.
In summary, evidence from robustness tests based on a simple ETF-based definition of the size effect mostly supports belief that the size effect concentrates in months after high values of lagged VIX.
However, investors pursuing this return concentration should be careful with strategy specifications.
Cautions regarding findings include:
- The available IWM-IWB sample is not long in terms of number of VIX regimes (bull and bear markets), and the 2008-2009 financial crisis is a dominant feature of the sample.
- Testing many model variations on the same data introduces data snooping bias, such that the best-performing variations overstate expectations.
- High-VIX sample size decreases as the VIX “highness” specification gets higher, undermining confidence in findings for very high VIX thresholds.