Does disentangling measures of stock illiquidity and market capitalization (size) support belief in an illiquidity premium (a reward for holding illiquid assets)? In the December 2016 version of their paper entitled “The Value of True Liquidity”, Robin Borcherding and Michael Stein investigate this question by controlling the most widely used stock illiquidity metric for size. Specifically they define and calculate true stock liquidities by:
- Calculating for each stock the conventional Amihud monthly measure of illiquidity (average absolute price impact of dollar trading volume during a month).
- Capture unexplained residuals from a regression that controls for the linear relationship (negative correlation) between this conventional illiquidity metric and size.
- Sorting stocks by size and capturing more detail regression residuals within size ranges to control for the non-linear relationship between conventional illiquidity and size.
They then form double-sorted portfolios to compare interactions of conventional and true liquidity with stock volatility and size. Using daily returns, trading data and characteristics for 4,739 U.S. common stocks during January 1990 through September 2015, they find that:
- A double sort on volatility and conventional illiquidity indicates that the most volatile and most illiquid stocks have the highest average gross monthly return (2.5%).
- However, a double sort an volatility and true illiquidity (controlled for size) indicates that the most volatile and most liquid stocks have the highest average gross monthly return (2.3%). The average market capitalization of this group is over eight times that of the high volatility-high conventional illiquidity group.
- The conventional illiquidity premium (extreme illiquid minus extreme liquid) has average gross monthly value 0.59% over the sample period, with 4-factor (market, size, book-to-market, momentum) gross monthly alpha 0.76%. Its 12-month moving average is inconsistently mostly negative until 2000 and positive thereafter.
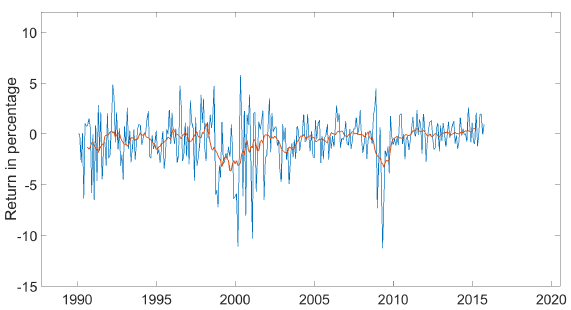
- The true illiquidity premium has average gross monthly value -0.64% over the sample period, with 4-factor gross monthly alpha -0.58%. Its 12-month moving average is consistently negative over the sample period.
- Findings are mostly robust to using a 3-month rather than 1-month portfolio formation period, skipping a month between illiquidity measurement and portfolio formation, and for rolling subperiods.
The following chart, taken from the paper, plots the true illiquidity gross monthly return premium and its 12-month moving average over the sample period. Calculation of the premium involves each month:
- Sorting stocks into thirds (terciles) by standard deviation of daily returns within the month.
- Sorting each volatility tercile into fifths (quintiles) based on true illiquidity.
- Calculating the average of the equally weighted monthly returns of the most illiquid minus the most liquid quintiles across all three volatility groups.
The 12-month moving average is consistently negative. There are indications of flight to liquidity during the bursting of the technology bubble in 2000 and the financial crisis of 2009.
In summary, evidence indicates that truly liquid stocks on average significantly outperform truly illiquid stocks.
Cautions regarding findings include:
- All calculations are gross, not net. Accounting for monthly portfolio reformation frictions and shorting costs would reduce returns. The most profitable stocks for conventional illiquidity are likely the most costly to trade and the most costly/difficult to short. True illiquidity somewhat mitigates this concern.
- True liquidity calculations are complex and beyond the reach of most investors, who would bear fees for delegating the work to an investment/fund manager.
See also “Measuring the Stock Illiquidity Premium” and “Illiquidity as a Stock Return Factor”.