In the current environment of low bond yields, what is a safe investment withdrawal rate during retirement? In their January 2013 paper entitled “The 4% Rule is Not Safe in a Low-Yield World”, Michael Finke, Wade Pfau and David Blanchett model the risk of exhausting wealth for different retirement durations, withdrawal rates, stocks-bonds portfolio mixes and assumptions about future market conditions (stock and bond returns). They model retirement portfolio dynamics via Monte Carlo simulations applied to log-normal return distributions, based on an inflation-adjusted withdrawal rate set at a percentage of investment portfolio value at retirement and annual rebalancing to a target asset allocation (with failure whenever a withdrawal results in a zero balance). They assume withdrawals cover any taxes due and ignore any portfolio fees/frictions. They focus on a 30-year retirement under current market conditions, with bonds yielding an average annual real return of -1.4% (based on current yields for 5-year Treasury Inflation-Protected Securities) and stocks yielding an average annual real return of 4.6% (6.0% equity risk premium over the bond yield). They also consider a case based on 1926-2011 average annual real returns of 2.6% for bonds and 8.6% for stocks, and cases for which current low returns revert to historical averages five or ten years into retirement. Using the specified modeling assumptions and parameters, they find that:
- Based on the conventional 4% withdrawal rate over a 30-year retirement, with stock allocations of 30%, 50% or 70%, retirement portfolio failure rates are:
- 6%, 6% and 8%, respectively, assuming historical average annual real returns of 8.6% for stocks and 2.6% for bonds.
- 47%, 33% and 28%, respectively, assuming 6% average annual real returns for stocks and 0% for bonds.
- 77%, 57% and 46%, respectively, assuming the current annual real returns of 4.6% for stocks and -1.4% for bonds.
- 22%, 18% and 18%, respectively, assuming the current annual real returns for the first five years of retirement and historical returns for the next 25 years.
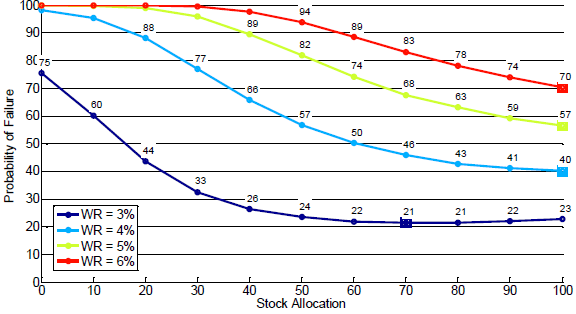
- Based on a 4% withdrawal rate over a 30-year retirement under current market conditions (annual real returns of 4.6% for stocks and -1.4% for bonds), even the optimal allocation of 100% to stocks results in a 40% retirement portfolio failure rate (see the chart below).
- For 95% assurance that the retirement portfolio will not fail, the maximum sustainable withdrawal rates and optimal stocks/bonds allocations are:
- 5.0% withdrawal rate and 27%/73% stocks/bonds allocations for a 15-year retirement.
- 3.6% and 32%/68% for a 20-year retirement.
- 2.7% and 33%/67% for a 25-year retirement.
- 2.2% and 44%/56% for a 30-year retirement.
- Assuming current market conditions persist, replacing bonds with single-premium annuities (for longevity protection) may improve retirement outcomes.
The following chart, taken from the paper, plots retirement portfolio failure rates during a 30-year retirement for stock allocations ranging from 0% to 100% and withdrawal rates (WR) ranging from 3% to 6% under current market conditions (annual real returns of 4.6% for stocks and -1.4% for bonds). Squares indicate the stock allocations for different WRs that minimize portfolio failure rates. For example, even a 3% WR with optimal 70% allocation to stocks results in a portfolio failure rate over 20%. The probability of exhausting wealth during retirement for the conventional 4% WR and allocations of 60% stocks/40% bonds is 50% .
In summary, modeling based on current U.S. bond and stock market returns indicates that the safe investment withdrawal rate over a lengthy retirement is much lower than the conventional 4% of wealth at retirement.
Cautions regarding findings include:
- As noted, analyses assume that withdrawals pay for taxes and optimistically ignore portfolio fees/frictions.
- The assumption of a 6.0% U.S. equity risk premium based on historical data may be optimistic.
- Analyses assume tame return distributions. To the extent that actual distributions are wild, the modeling methodology breaks down.
- Spending requirements may vary considerably during retirement, as addressed in “Allocating Assets for Retirement”, such that a constant withdrawal rate does not match needs.