“Pervasiveness and Robustness of SMA Effectiveness for Stocks” summarizes research finding that applying a simple moving average (SMA) trading strategy to U.S. stock portfolios produces strong risk-adjusted performance. This strategy is in stocks (cash) when price is above (below) its SMA. Is this finding valid? In his March 2016 paper entitled “Revisiting the Profitability of Market Timing with Moving Averages”, Valeriy Zakamulin challenges the validity of the research. First, he replicates the finding via simulations that incorporate one-month look-ahead bias (by including the last month of SMA calculation intervals as a strategy return). He then corrects strategy return calculations to eliminate this bias. As in the original research, he bases simulations on the following:
- Test data are monthly value-weighted returns of three sets of 10 portfolios from the data library of Kenneth French, each set formed by sorting on market capitalization, book-to-market ratio or momentum.
- Return on cash is the one-month U.S. Treasury bill yield.
- One-way stocks-cash switching cost is 0.5%.
- The sample period is January 1960 through December 2011.
Key performance metrics are net Sharpe ratio and four-factor alpha (adjusting for market, size, book-to-market and momentum factors). Using the specified data and assumptions, he finds that:
- The look-ahead bias in the original research explains the extraordinary effectiveness of SMA strategies in that study.
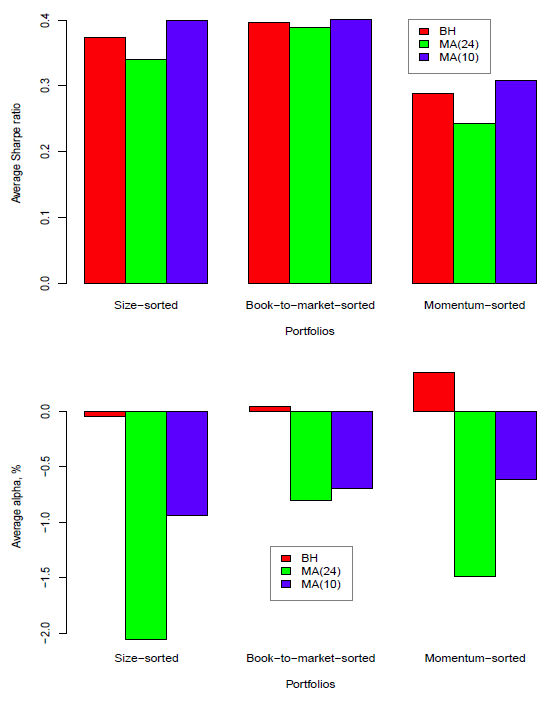
- In other words, after removing the bias, SMA strategy performance is at best only marginally better than that of the corresponding buy-and-hold strategy. Any outperformance is not statistically significant. Specifically (see the charts below):
- Average net Sharpe ratio of a 24-month SMA strategy is lower than that of buy-and-hold.
- Average net Sharpe ratio of a 10-month SMA strategy is marginally higher than that of buy-and-hold, but the outperformance is not statistically significant.
- Average alphas of the SMA strategy are negative because the strategy employs momentum.
The following charts, taken from the paper, summarize average net Sharpe ratios (upper chart) and average four-factor alphas) for simulations of a 24-month SMA strategy, a 10-month SMA strategy and a corresponding buy and hold strategy after removing the look-ahead bias in the original research. Results show that the SMA strategy does not convincingly improve risk-adjusted performance. Results suggest that the SMA strategy is an inefficient way to exploit the momentum effect.
In summary, evidence does not support belief that SMA-based U.S. stock portfolio timing strategies significantly improve risk-adjusted performance.
Cautions regarding findings include:
- Findings for the 10-month SMA strategy may incorporate data snooping bias inherited from much prior research on U.S. stocks, making this measurement interval a “conventional” length.
- The paper does not provide details on the simulation method (but does offer the program code for independent testing).
See also “Net Performance of SMA and Intrinsic Momentum Timing Strategies”, “Long-run Moving Average Horse Race for Timing the U.S. Stock Market” and “Best Moving Average Weighting Scheme for Market Timing?”.