A reader inquired about the complex strategy for trading stock index proxies and futures described in the March 2010 paper “MR Swing: A quantitative System for Mean‐reversion and Swing Trading in Market Regimes” by David Abrams and Scott Walker. This strategy posits that:
- The stock market switches between bull and bear states, with the bull or bear state in effect when current index level is above or below a channel generated by 200-day simple moving averages (SMA) of daily highs and lows. The channel buffers whipsaws.
- Different (not symmetrically opposite) trading approaches work best during these two states. Specifically, swing trading (short-term mean reversion) works in the bull (bear) state.
- Mean reversion and swing trading signal calculations must incorporate stock market volatility.
- The swing trading and mean reversion components must not produce serious drawdowns when the 200-day SMA indicator whipsaws between bull and bear states.
Using fairly recent daily data for the S&P 500 Index, SPDR S&P 500 (SPY), exchange-traded fund (ETF) proxies for several other stock market indexes and index futures, they find that:
- During January 1999 through mid-February 2010, trading simple daily mean reversion of the S&P 500 Index generates a gross compound annual return of 0.7% (11.9%) in bull (bear) market states. Bear market outperformance concentrates during the 2008-2009 financial crisis.
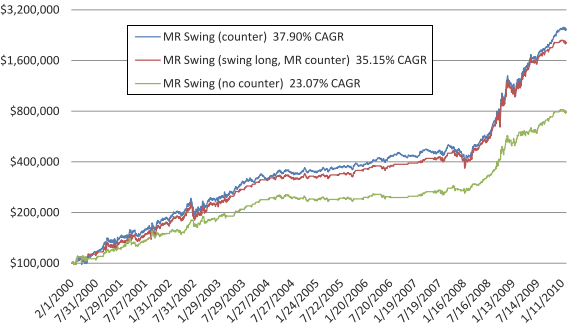
- During February 2000 through mid-February 2010, as applied to SPY (see the chart below):
- A conservative long-only MR Swing strategy is in the market 48% of the time and generates a gross compound annual return of 23%, with maximum drawdown 13%.
- An aggressive long-short MR Swing strategy is in the market 99% of the time and generates a gross compound annual return of 38%, with maximum drawdown 24%.
- Because of broad use of limit orders, bid-ask spreads have an insignificant impact on profitability. However, calculations exclude trading commissions and tax implications.
- MR Swing results are generally attractive when applied to iShares MSCI Emerging Markets Index (EEM), iShares Russell 2000 Index (IWM), PowerShares QQQ (QQQ) and Vanguard Total Stock Market ETF (VTI) over the period July 2000 through January 2010.
- Results are also generally attractive for index futures under various capital management assumptions (including commissions), but dependence of profitability on extreme bear market conditions (especially the 2008-2009 financial crisis) appears elevated.
- Adding the MR Swing strategy as an asset class to the Ivy Portfolio enhances the performance of that portfolio.
The following chart, taken from the paper, compares the cumulative gross values of $100,000 initial investments in three variations of the MR Swing strategy:
- MR Swing (counter) is aggressively long-short during both bull and bear markets.
- MR Swing (swing long, MR counter) is long-only during bull markets and long-short during bear market.
- MR Swing (no counter) is conservatively long-only during both bull and bear markets.
It appears that the strategies are most profitable during bear market states, most notably during the 2008-2009 financial crisis. Short-term reversion (which may involve high trading frequency) is the active component during these states.

In summary, evidence from tests over the last decade suggest that the complex MR Swing strategy for stock index proxies and future may produce strong returns in a modern market environment. However, strategy performance appears substantially dependent on the extreme bear market conditions of the 2008-2009 financial crisis.
Cautions regarding findings include:
- While the authors do not explicitly optimize variable construction/combination alternatives and parameter settings, they draw on results of other studies that may impound material data snooping biases. The building block approach of the MR Swing strategy has the potential to compound any such biases.
- All test periods are very short in terms of independent 200-day bull-bear state determination intervals. As noted above, the very unusual conditions of the 2008-2009 financial crisis are a substantial contributor to MR Swing strategy profitability.
- While using opening prices and limit orders to obviate bid-ask friction, the profitability calculations exclude trading commissions and any costs of shorting for the long-short strategy variation. Including reasonable transaction fees and shorting costs would lower strategy profitability. It appears that trading is most frequent, and trading commissions thus more important, during bear markets.
- Supporting tests of S&P 500 Index simple daily mean reversion derive from analyses of indexes rather than tradable proxies, which may behave differently. Moreover, results of these supporting tests are gross, not net. Including reasonable trading frictions would dramatically reduce profitability.