A reader asked about the usefulness of the S&P Short-range Oscillator as sometimes used by Jim Cramer to forecast U.S. stock market returns. The self-reported “Performance” of the oscillator, relying on in-sample visual inspection with snooped thresholds, is of small use. Since continuous historical values of the indicator are not publicly available, we conduct an out-of-sample test by:
- Searching CNBC.com for “Oscillator” “Mad Money” and just “Oscillator” on October 3, 2019 and identifying articles with U.S. stock market forecasts from Jim Cramer based on the S&P Short-range Oscillator.
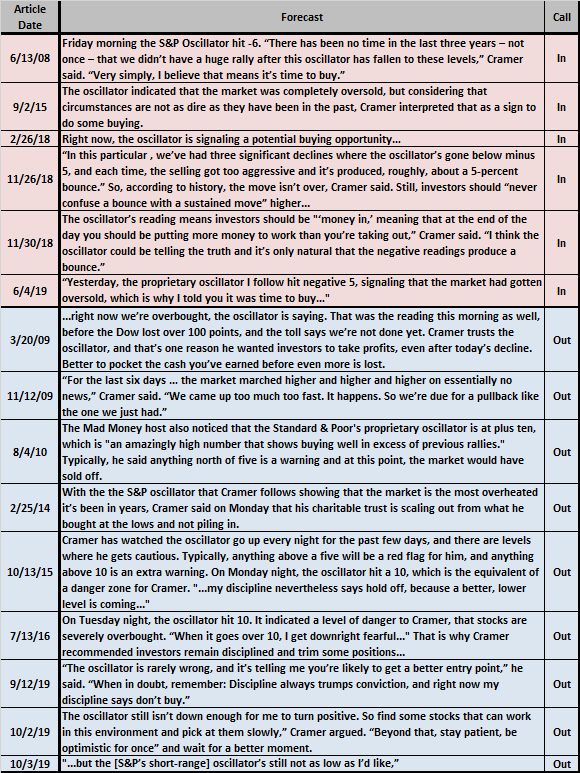
- Extracting the date for each forecast and determining whether it is call to be “In” or “Out” of the market.
- Calculating for each call a cumulative S&P 500 Index return starting at the next open after the article date (generally timestamped after the market close) for 21 trading days.
- Computing average cumulative performances of “In” and “Out” calls.
- Comparing these averages to that for all days spanning the search results.
Using the 15 qualifying articles and daily opening levels of the S&P 500 Index during June 16, 2008 through October 31, 2019, we find that:
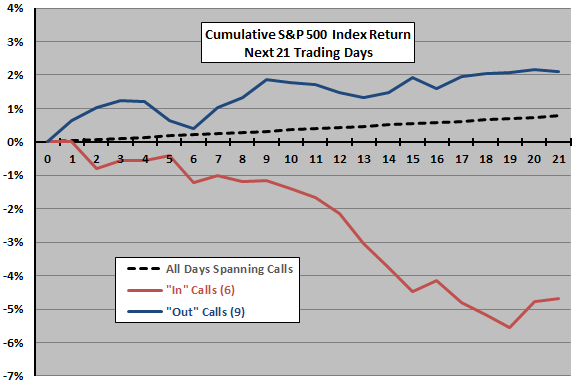
Of the 15 qualifying articles, six are “In” and nine are “Out” calls. Five calls have cumulative return intervals that overlap with one or two other calls. It is arguable that clustered calls indicate high conviction, and we do not therefore winnow them.
The following chart tracks average cumulative S&P 500 Index returns for the 21 trading days (open to open) after “In” calls, “Out” calls and all days from the first call through 10/31/2019. On average, “In” (“Out”) calls underperform (outperform) average S&P 500 Index behavior. In other words, doing the opposite of the calls is advantageous.
In summary, very limited evidence indicates that the S&P Short-range Oscillator as applied by Jim Cramer does not work as described.
Cautions regarding findings include:
- The “In” and “Out” call subsamples are extremely small for reliable inference (but clearly do not support belief in usefulness of the indicator).
- Conversely, results do not strongly support belief that the calls are reliable contrarian signals.
For other research related to Jim Cramer, followed this search link.
The following table provides dates, quotes and associated “In” or “Out” judgments from qualifying articles for readers who may wish to check findings.