How sensitive in a recent sample are outcomes from simple trend following rules to the length of the measurement interval used to detect a trend. To investigate, we consider two simple types of trend following rules as applied to the U.S. market:
- Hold a risky asset when its price is above its x-month simple moving average (SMAx) and cash when below, with x ranging from two to 12.
- Hold a risky asset when its x-month return, absolute or intrinsic momentum (IMx), is positive and cash when negative, with x ranging from one to 12.
Specifically, we apply these 23 rule variations to time the S&P 500 Index since the inception of SPDR S&P 500 (SPY) as an easy and flexible way to trade the index over the available sample period and two subperiods, the decade of the 2000s and the last five years. We use the yield on 3-month U.S. Treasury bills (T-bills) to approximate return on cash. We use buying and holding SPY as a benchmark for the active rules. Using monthly closing levels of the S&P 500 Index since April 1992 and dividend-adjusted prices for SPY and T-bill yields since January 1993, all through March 2014, we find that:
Calculations employ the following additional assumptions:
- It is possible to anticipate the simple SMAx and IMs signals slightly, such that signals and trades occur at the same monthly closes.
- One-way trading friction is 0.2% of the balance.
- Ignore tax implications of trading.
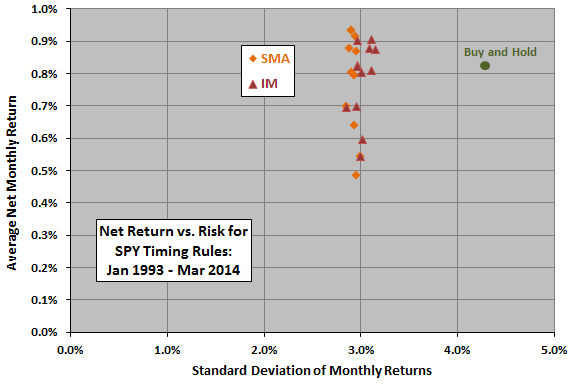
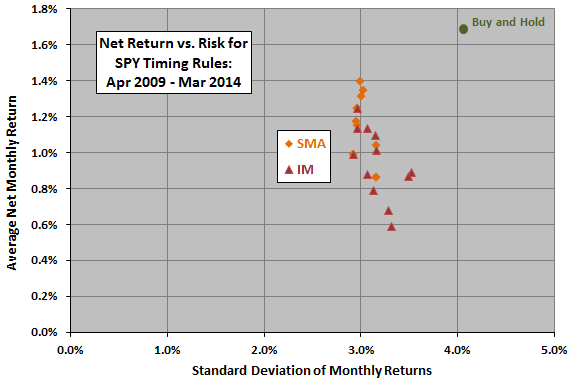
The following scatter plot relates average net monthly return to standard deviation of monthly returns for all rule variations and for the buy-and-hold benchmark over the entire sample period. The timing rule variations are about equally effective at suppressing volatility compared to buy-and-hold, but average returns differ substantially.
Among SMA measurement intervals, SMA9 and SMA10 have the highest net monthly reward-to-risk ratio (0.32), while SMA3 has the lowest (0.16). Among IM measurement intervals, IM6 has the highest net monthly reward-to-risk ratio (0.30), while IM1 has the lowest (0.18). The ratio for the buy-and-hold benchmark is 0.19.
The month-to-month serial correlation of S&P 500 Index returns over the entire sample period is 0.08, suggesting some trending in monthly levels. The monthly serial correlation for the index since 1950 is 0.04.
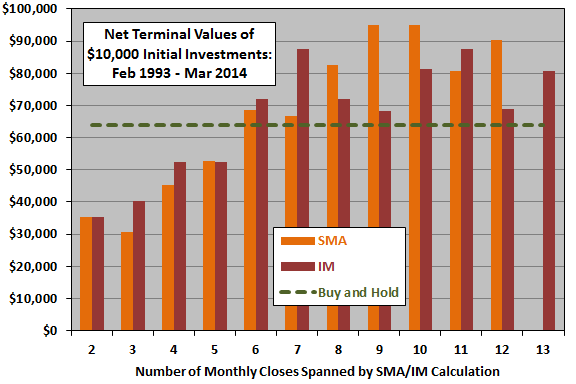
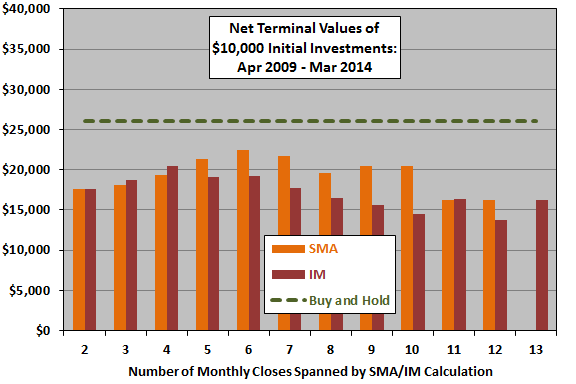
For another perspective, we look at terminal values of $10,000 initial investments in each rule variation.
 The following chart compares net terminal values of $10,000 initial investments in SPY or cash for the 23 SMA and IM rule variations, and for the buy-and-hold benchmark, over the entire sample period. For example, “10” corresponds to SMA10 and IM9, both of which span ten consecutive monthly S&P 500 Index closes.
Results confirm that SMA9/SMA10 and IM6 are optimal. Results also indicate that: (1) short measurement intervals do not perform well compared to the buy-and-hold benchmark; and, (2) variation in outcomes across long measurement intervals is noisy rather than systematic.
Are results consistent for subperiods?
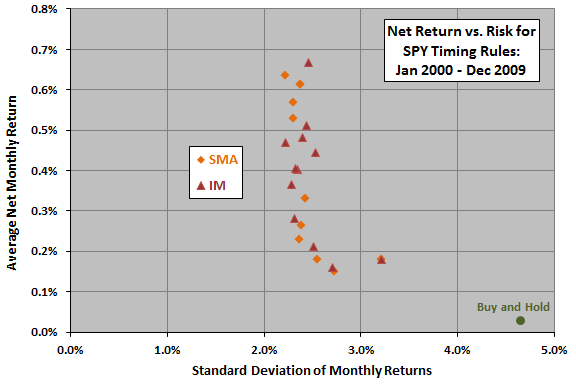
The next scatter plot relates average net monthly return to standard deviation of monthly returns for all rule variations and for the buy-and-hold benchmark during the turbulent 2000s. Again, the timing rule variations differentiate much more by return than by volatility.
Among SMA measurement intervals, SMA12 has the highest net monthly reward-to-risk ratio (0.29), while SMA3 again has the lowest (0.05). Among IM measurement intervals, IM6 again has the highest net monthly reward-to-risk ratio (0.27), while IM1 and IM2 have the lowest (0.06). The ratio for the buy-and-hold benchmark is 0.01.
The month-to-month serial correlation of S&P 500 Index returns during this subperiod is 0.17, suggesting relatively strong trending in monthly levels compared to above.
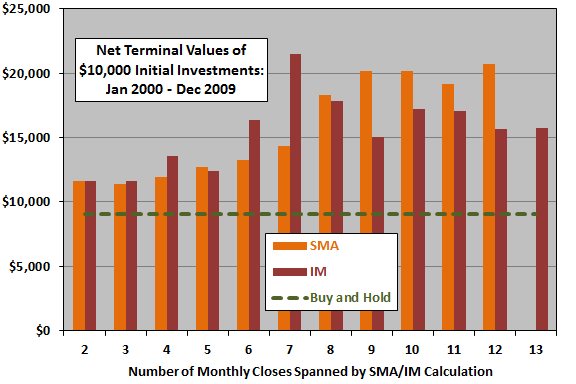
For another perspective, we again look at terminal values of $10,000 initial investments in each rule variation.
The next chart compares net terminal values of $10,000 initial investments in SPY or cash for the 23 SMA and IM rule variations, and for the buy-and-hold benchmark, during the 2000s. Results confirm that SMA12 and IM6 are optimal. Results also indicate that: (1) short measurement intervals are again suboptimal, but they still beat the very weak buy-and-hold benchmark; and, (2) variation in outcomes across long measurement intervals is again noisy rather than systematic. During the 2000s, every rule variation beats buying and holding SPY.
What about the last five years?
 The next scatter plot relates average net monthly return to standard deviation of monthly returns for each rule and for the buy-and-hold benchmark over the last five years. Again, the timing rule variations differentiate much more by return than by volatility.
Among SMA measurement intervals, SMA6 has the highest net monthly reward-to-risk ratio (0.47), while SMA11 and SMA12 have the lowest (0.27). Among IM measurement intervals, IM3 has the highest net monthly reward-to-risk ratio (0.42), while IM11 has the lowest (0.18). The ratio for the buy-and-hold benchmark is 0.42.
The month-to-month serial correlation of S&P 500 Index returns during this subperiod is -0.02, suggesting little or no trending in monthly levels compared to above.
For another perspective, we again look at terminal values of $10,000 initial investments in each rule variation.
The final chart compares net terminal values of $10,000 initial investments in SPY or cash for the 23 SMA and IM rule variations over the last five years. Results confirm that SMA6 and IM3 are the best timing rules, but buy-and-hold is optimal. Over the last five years, none of the rule variations beat buying and holding SPY.
In summary, evidence indicates that simple trend following strategies based on commonly used indicators and applied to the U.S. stock market behave differently at different times, with performance and optimality contingent on return serial correlation.
Results suggest that the simple timing strategies with relatively long measurement intervals work over long periods that include a substantial proportion of bear markets.
Cautions regarding findings include:
- Testing multiple signals on the same data set introduces data snooping bias (luck), such that results for the best (worst) signal probably overstate (understate) reasonable expectations. Lack of patterns across measurement intervals amplifies this concern.
- Neither the overall sample period nor (especially) the subperiods are long in terms of number of independent measurement intervals for long signals or in terms of number of bull-bear cycles.
- Results suggest that the tendency of the S&P 500 Index to trend (as indicated by serial correlation) is not stable. In other words, the index may have no persistently cyclic behavior.
- Ignoring tax implication puts the buy-and-hold benchmark at a disadvantage for many investors.
For related research, see “Net Performance of SMA and Intrinsic Momentum Timing Strategies”, “Intrinsic Momentum or SMA for Avoiding Crashes?”, “The 2000s: A Market Timer’s Decade?” and “Optimal Intrinsic Momentum and SMA Intervals Across Asset Classes”.