Does a carry trade derived from roll yields of futures/forward contracts work within asset classes (undiversified) and across asset classes (iversified)? In his May 2017 paper entitled “Optimising Cross-Asset Carry”, Nick Baltas explores the profitability of cross-sectional (relative) and time-series (absolute) carry strategies within and across futures/forward markets for currencies, stock indexes, commodities and government bonds. He posits that contracts in backwardation (contango) present a positive (negative) roll yield and should generally be overweighted (underweighted) in a carry portfolio. He considers three types of carry portfolios, each reformed monthly:
- Cross-sectional (XS) or Relative – Rank all assets within a class by strength of carry, demean the rankings such that half are positive and half are negative and then assign weights proportional to demeaned ranks to create a balanced long-short portfolio. Combine asset classes by applying inverse volatility weights (based on 100-day rolling windows of returns) to each class portfolio.
- Times-series (TS) or Absolute – Go long (short) each asset within a class that is in backwardation (contango), such that the class may be net long or short. Combine asset classes in the same way as XS.
- Optimized (OPT) – Apply both relative strength and sign of carry to determine gross magnitude and direction (long or short) of positions for all assets, and further apply asset volatilities and correlations (based on 100-day rolling windows of returns) to optimize return/risk allocations.
Using daily data for 52 futures series (20 commodities, eight 10-year government bonds, nine currency exchange rates versus the U.S. dollar and 15 country stock indexes) during January 1990 through January 2016, he finds that:
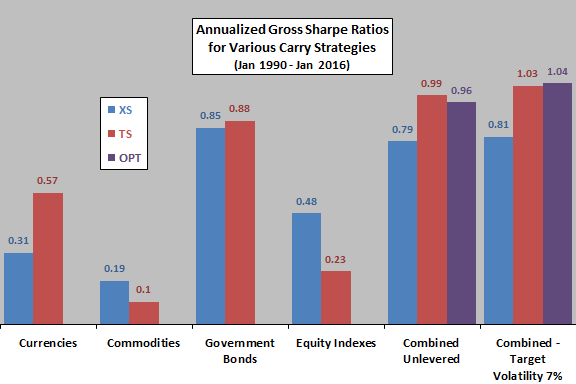
- For XS carry portfolios (see the chart below):
- All individual asset classes generate positive annualized gross Sharpe ratios, ranging from 0.19 for commodities to 0.85 for government bonds. Maximum drawdowns range from 5.2% for government bonds to 26.3% for commodities.
- The multi-class portfolio generates annualized gross Sharpe ratio 0.79 with maximum drawdown 4.2%.
- The multi-class portfolio with leverage (average 4X) to target 7% annualized volatility generates gross annualized Sharpe ratio 0.81 with maximum drawdown 18.6%.
- For TS carry portfolios:
- All individual asset classes generate positive annualized gross Sharpe ratios, ranging from 0.10 for commodities to 0.88 for government bonds. Maximum drawdowns range from 7.9% for government bonds to 61.9% for stock indexes.
- The multi-class portfolio generates annualized gross Sharpe ratio 0.99 with maximum drawdown 6.4%.
- The multi-class portfolio with leverage (average 3.3X) to target 7% annualized volatility generates gross annualized Sharpe ratio 1.03 with maximum drawdown 18.4%.
- Return correlations between XS and TS carry strategies by asset class and at the multi-class level are not high, suggesting diversification value in combining them.
- For combined XS and TS carry portfolios:
- The OPT multi-asset portfolio generates annualized gross Sharpe ratio 0.96 with maximum drawdown 3.7%.
- The OPT multi-class portfolio with leverage (average 7.1X) to target 7% annualized volatility generates gross annualized Sharpe ratio 1.04 with maximum drawdown 18.9%.
- A 50-50 XS-TS portfolio with leverage (average 2.8X) to target 7% annualized volatility, rebalanced monthly, generates annualized gross Sharpe ratio 0.99 with maximum drawdown 15.5%.
- An inverse volatility weighted XS-TS portfolio with leverage (average 3.0X) to target 7% annualized volatility, rebalanced monthly, generates annualized gross Sharpe ratio 1.01 with maximum drawdown 17.5%.
The following chart, constructed from data in the paper, compares annualized gross Sharpe ratios for XS and TS asset class carry portfolios and for XS, TS and OPT multi-class carry portfolios over the sample period. Result indicate that:
- Across the four asset classes, the carry strategy is most attractive for government bonds.
- TS and OPT diversified across asset classes are relatively attractive.
In summary, evidence indicates that diversifying a carry trade defined by futures/forward contract roll yields across asset classes generates attractive gross performance with greatly suppressed downside risk.
Cautions regarding findings include:
- The sample period is not long in terms of number of economic/market cycles.
- Performance results are gross, not net. Accounting for monthly portfolio reformation costs and any cost of leverage would reduce returns.
- Models, especially OPT, are fairly complex with multiple construction and parameter choices and therefore potential for snooping bias. Applying multiple models to the same data introduces another layer of snooping bias, such that the best-performing model overstates expectations.
- Methods are beyond the reach of many investors, who would bear fees for delegating execution to a fund manager.
- The OPT portfolio may not be worth the additional data collection/computation compared to simpler ways (50-50 and inverse volatility) of combining XS and TS portfolios.
See also: