Are widely used stock factor premiums amenable to timing based on the ratio of aggregate valuation of stocks in the long side to aggregate valuation of stocks in the short side of the factor portfolio (the value spread)? In their March 2017 paper entitled “Contrarian Factor Timing is Deceptively Difficult”, Clifford Asness, Swati Chandra, Antti Ilmanen and Ronen Israel test a strategy that times factor portfolios based on the value spread, in single-factor or multi-factor portfolios. They consider three annually rebalanced factor hedge portfolios: (1) value (High Minus Low book-to-market ratio, or HML); (2) momentum (Up Minus Down, or UMD); and, (3) low beta (Betting Against Beta, or BAB). Their main measure for calculating the value spread is book-to-market ratio, so that a high (low) value spread implies a cheap (expensive) factor. To standardize the value spread, they use z-scores (number of standard deviations above or below the historical average, with positive values indicating undervalued). They use the first 120 months of data to calculate the first z-score. They compare performances of factor portfolios without timing to performances of the same portfolios with a timing overlay that varies capital weights for a factor between 50% and 150% of its passive weight according to the factor’s value spread (scaled to total portfolio weight 100%). They consider variants that are and are not industry neutral. Using factor and return data for large-capitalization U.S. stocks during 1968 through 2016, they find that:
- Based on value spreads, none of HML, UMD and BAB are extremely cheap or expensive at the end of 2016. However, value spreads differ widely for different valuation metrics.
- Correlations between value spreads and next-year returns for the individual factor portfolios indicate frail relationships (even negative for BAB).
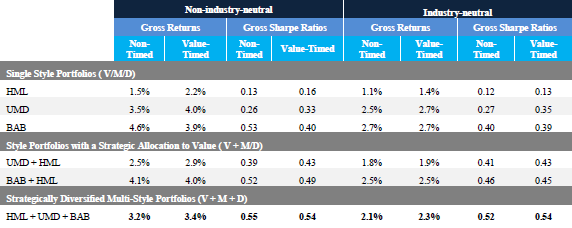
- Applying the specified value spread timing strategy on a gross basis to factor portfolios that are not industry neutral (see the table below):
- Increases average return of an HML portfolio but with higher volatility, such that Sharpe ratio increases only slightly (0.13 to 0.16).
- Increases average return and Sharpe ratio (0.26 to 0.33) of a UMD portfolio, perhaps because momentum and valuation are mutually diversifying. However, the improved Sharpe ratio is less than that of an untimed HML-UMD 2-factor portfolio (0.39).
- Decreases average return and Sharpe ratio (0.53 to 0.40) of a BAB portfolio.
- Increases average return and Sharpe ratio (0.39 to 0.43) of an HML-UMD portfolio. However, the improved Sharpe ratio is less than that of an untimed HML-UMD-BAB 3-factor portfolio (0.39).
- Increases the average return of an HML-UMD-BAB 3-factor portfolio but with higher volatility, such Sharpe ratio actually decreases slightly (0.55 to 0.54).
- A general conclusion is that adding value spread timing to optimally diversified multi-factor portfolios that already include a value factor undermines diversification and weakens performance.
- Results for industry-neutral versions of the factor portfolio are largely consistent.
- Using a 3-year rather than a 1-year rebalancing interval produces similarly weak results.
- Modifying the test to time a multi-factor portfolio only when value spreads breach extreme upper and lower thresholds slightly increases gross Sharpe ratio for some relatively higher threshold values, but results for different thresholds are inconsistent.
- Tests of several multi-factor portfolios comprised of global stocks timed with value trends derived from a composite valuation metric produce even weaker results. In fact, average Sharpe ratio is lower for the timed than the untimed portfolios.
The following table, taken from the paper, summarizes average gross annual returns and gross annual Sharpe ratios for single-factor, two-factor and three-factor portfolios, with and without value spread timing, and with and without industry neutrality. Results indicate that value spread timing sometimes modestly increases and sometimes modestly decreases gross Sharpe ratios compared to untimed portfolios. The higher turnover and transaction costs of timing may eliminate all advantages of value spread timing.
In summary, evidence indicates that value spread timing of value, momentum and low beta factor portfolios is not attractive.
Cautions regarding findings include:
- As noted in the paper, reported results are gross, not net. Accounting for annual rebalancing and continuous shorting costs of factor portfolios and for reallocations driven by factor portfolio value spread timing would reduce all results. Costs may vary by factor and by the valuation metric used to calculate factor portfolio value spread.
- The approach does not consider the relative attractiveness of stocks and non-equity asset classes as a potentially important driver of stock valuations.
- Testing multiple strategies/variations on the same data introduces snooping bias, such that the best result overstates expectations.
See also the related “Factor Investing Wisdom?” and “Factor Portfolio Valuation and Timing of Factor Premiums”.