Can investors exploit monthly persistence in the value premium for U.S. stocks? In his February 2014 paper entitled “Exploiting Factor Autocorrelation to Improve Risk Adjusted Returns”, Kevin Oversby investigates whether investors can exploit the fact that the Fama-French model high-minus-low (HML) value factor exhibits positive monthly autocorrelation (persistence). The HML factor derives from the difference in performance between portfolios of stocks with high and low book-to-market ratios. Prior published research indicates that the value premium concentrates in small firms, so he focuses on stocks with market capitalizations below the NYSE median. His test strategies each month invest in capitalization-weighted small value (small growth or small momentum) Fama-French portfolios when the prior-month sign of the HML factor is positive (negative). The strategies additionally retreat to a risk-free asset (such as U.S. Treasury bills) if the prior-month return for the test strategy is negative. Using HML factor values and monthly portfolio returns for small value, small growth and small momentum Fama-French portfolios, he finds that:
- Over the decades 1985-1995, 1995-2005 and 2005-present, monthly autocorrelations of the HML factor are 0.26, 0.25 and 0.34.
- For switching between value and growth portfolios:
- Gross annualized returns are 13.4%, 10.6% and 15.3% for the small value portfolio, the small growth portfolio and the small value-small growth timing strategy, respectively.
- Corresponding gross annualized Sharpe ratios are 0.7, 0.7 and 1.1.
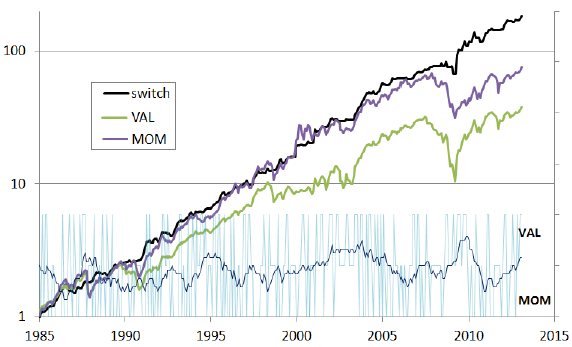
- For switching between value and momentum portfolios (see the chart below):
- Gross annualized returns are 13.4%, 16.1% and 19.7% for the small value portfolio, the small momentum portfolio and the small value-small momentum timing strategy, respectively.
- Corresponding gross annualized Sharpe ratios are 0.7, 0.8 and 1.3.
- Corresponding maximum drawdowns are 62.8%, 51.4% and 18.3%.
- The strategy switches an average seven times per year.
- Implementation costs for the small value-small momentum timing strategy are roughly 0.35% per year for exchange-traded fund (ETF) fees and 0.7% per year for fund switching (0.05% per one-way trade), for a total of 1.05% per year.
- Gross results are generally similar for equal-weighted portfolios and for a 1954-1984 sample.
The following chart, taken from the paper, shows gross cumulative values of $1 initial investments at the end of 1984 in the small value Fama-French portfolio (VAL) the small momentum Fama-French portfolio (MOM) and the small value-small momentum timing strategy (switch). The terminal value for the timing strategy is about $200. The lower part of the chart shows the stance of the strategy: up = value, down = momentum and center = risk-free asset, with a moving average overlay for visualization of stance persistence. Note that the timing strategy moves persistently into the value portfolio after the recessions of 2002 and 2008.
In summary, evidence indicates that investors may be able to exploit the persistence of the value premium at a monthly frequency via a strategy that holds a small value (small momentum) portfolio when the prior-month Fama-French HML factor is positive (negative), except holding cash when the prior-month return for the strategy is negative.
Cautions regarding findings include:
- Prior-month HML factor values may not be available for immediate monthly switching. Delayed signal execution may degrade strategy performance.
- The study does not explore the relative contributions of: (1) timing value-growth or value-momentum stock portfolios based on the prior-month sign of the HML factor; and, (2) timing the equity market based on the prior-month sign of the timing strategy portfolio. It is possible that the latter is more important than the former.
- The study does not verify that available, low-cost ETFs perform comparably to the ideal Fama-French small-stock portfolios. Moreover, such ETFs were not available over most of the sample period.
- Some investors may not be able to achieve the assumed 0.05% friction for one-way trading into and out of indicated ETFs.