Do relative momentum and trend filters operate differently on value and growth stocks? In their May 2014 paper entitled “When Growth Beats Value: Removing Tail Risk from Global Equity Momentum Strategies”, Andrew Clare, James Seaton, Peter Smith and Stephen Thomas investigate the effects of relative momentum and trend filters on portfolios of developed and emerging market broad, value and growth stock indexes. Their relative momentum filter each months picks either the top five indexes (Mom5) or top quarter of indexes (Mom25%) based on volatility-adjusted past 12-month return (return divided by standard deviation of monthly returns) at the end of the prior month. Their trend filter each month invests in an index or U.S. Treasury bills (T-bills) according to whether the index is above or below its 10-month simple moving average (SMA10) at the end of the prior month. Using monthly levels of broad, value and growth stock indexes for 23 developed country markets (since 1976) and 21 emerging country markets (since 1998) through 2012, they find that:
- Value stocks tends to outperform growth stocks across periods and market categories. For example, gross annualized Sharpe ratios of equally weighted portfolios of value and growth indexes are:
- 0.47 and 0.35, respectively, for developed markets since 1976.
- 0.47 and 0.32, respectively, for emerging markets since 1998.
- Mom5 and Mom25% relative momentum filters improve Sharpe ratios of developed market value and especially growth index portfolios since 1976, but not the performance of emerging market portfolios since 1998. Even for the developed market portfolio, the filters do not reduce maximum drawdowns.
- A portfolio that each month chooses either the value or growth index for each country based on which has the larger volatility-adjusted return over the past 12 months offers attractive Sharpe ratios for developed markets since 1976 and emerging markets since 1998, but again does not substantially reduce maximum drawdowns.
- The SMA10 trend filter substantially improves performance and suppresses maximum drawdowns across periods and market categories. For example, this filter:
- Boosts gross annualized Sharpe ratios for developed market portfolios since 1976 from 0.47 to 0.72 for value indexes and from 0.35 to 0.65 for growth indexes.
- Boosts gross annualized Sharpe ratios for emerging market portfolios since 1998 from 0.47 to 0.73 for value indexes and from 0.32 to 0.65 for growth indexes.
- Reduces maximum drawdown for developed market portfolios since 1976 from 61.2% to 18.7% for value indexes and from 57.5% to 20.8% for growth indexes.
- Reduces maximum drawdown for emerging market portfolios since 1998 from 55.1% to 15.5% for value indexes and from 60.0% to 17.6% for growth indexes.
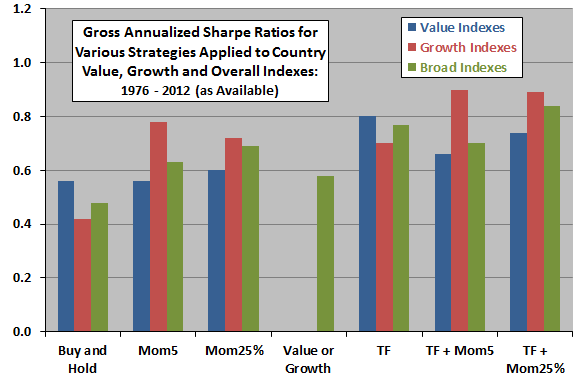
- Combining the SMA10 trend filter with a relative momentum filter is especially effective at boosting Sharpe ratios for growth index portfolios (see the chart below).
- These strategies generate less than one round trip transaction per country per year on average, suggesting that accounting for trading frictions would not affect findings.
The following chart, constructed from data in the paper, summarizes gross annualized Sharpe ratios for seven strategies applied to country broad, value and growth stock indexes as they become available during 1976 through 2012:
- Buy and Hold – equally weighted combination of all country indexes, rebalanced monthly.
- Mom5 – equally weighted five country indexes with highest prior-month momentum, reformed monthly.
- Mom25% – equally weighted fourth of available country indexes with the highest prior-month momentum, reformed monthly.
- Value or Growth – equally weighted combination of value or growth indexes selected country by country based on whether value or growth has the higher volatility-adjusted past 12-month return, reformed monthly.
- Trend Following (TF) – equally weighted combination of country indexes (positions in T-bills) for indexes that are above (below) their respective SMA10s, reformed monthly.
- TF + Mom5 – Mom5 strategy but with T-bills substituted for any winner index that is below its SMA10 at the end of the prior month.
- TF + Mom25% – Mom25% strategy but with T-bills substituted for any winner index that is below its SMA10 at the end of the prior month.
Results indicate that relative momentum and trend following filters generally improve performance and that momentum filters improve performance of growth stock indexes much more than value stock indexes.

In summary, evidence indicates that relative momentum and trend filters improve the gross performance of a diversified portfolio of country indexes, and that improvement from momentum filters concentrates in growth stocks.
Cautions regarding findings include:
- Performance measurements are gross, not net.
- Use of indexes rather than tradable assets ignores the costs of maintaining liquid tracking funds.
- Incorporation of frictions for monthly portfolio reformation (both switching and rebalancing to equal weights) would reduce reported performance.
- The authors state: “Where ETFs are available for these countries, the developed ones should cost less than 50bp per year and the emerging ones around 65bp, with transaction fixed charges of only a few bps per purchase or sale, and under one transaction per asset per year on average.” This statement appears to ignore the monthly rebalancing of all portfolio components to equal weights.
- Moreover, easy access to country broad, value and growth stock indexes via ETFs may stimulate future market adaptation to opportunities exposed in the above backtests.
- Sample periods are not long relative to 12-month and 10-month filter measurement intervals or in terms of number of equity bull and bear markets.
- Exploration of multiple strategies on the same data, and the same strategy on different data, introduces data snooping bias. Performance of the best strategy so identified likely overstates expected performance. Moreover, selection of measurement interval lengths may impound snooping bias from past research.