How do the behaviors of time-series (absolute) and cross-sectional (relative) carry, momentum and value strategies differ? In the November 2015 version of their paper entitled “Dissecting Investment Strategies in the Cross Section and Time Series”, Jamil Baz, Nicolas Granger, Campbell Harvey, Nicolas Le Roux and Sandy Rattray explore time-series and cross-sectional carry, momentum and value strategies as applied to multiple asset classes. They adapt to each asset class the following general definitions:
- Carry – buy (sell) futures on assets for which the forward price is lower (higher) than the spot price.
- Momentum – buy (sell) assets that have outperformed (underperformed) over the past 6-12 months.
- Value – buy (sell) assets for which market price is lower (higher) than estimated fundamental price.
For cross-sectional portfolios, they rank assets within each class-strategy and form portfolios that are long (short) the equally weighted six assets with the highest (lowest) expected returns, rebalanced daily except for currency carry and value trades. For time-series portfolios, they take an equal long (short) position in each asset within a class-strategy according to whether its expected return is positive (negative). When combining strategies within an asset class, they use equal weighting. When combining across asset classes, they scale each class-strategy portfolio to a 15% annualized volatility target. Using daily contract closing bid-ask midpoints for 26 equity futures, 14 interest rate swaps, 31 currency exchange rates and 16 commodity futures during January 1990 through April 2015, they find that:
- Regarding cross-sectional portfolios:
- Gross annual Sharpe ratios are positive for all class-strategies except one (interest rate swap momentum).
- Gross annual Sharpe ratios averaged simply across strategies range from 0.34 for interest rate swaps to 0.61 for currency exchange.
- Gross annual Sharpe ratios for combining across asset classes with equal volatility targets range from 0.42 for momentum to 1.27 for carry. Performance is consistently positive for value and, except for the middle of the 1990s, for carry. Performance for momentum is weak over the last few years.
- Combined across asset classes over the entire sample period, momentum and carry correlate positively. Value correlates negatively with both carry and momentum.
- Combining across both strategies and asset classes, overall gross annual Sharpe ratio is 1.40. Three-year gross annual Sharpe ratio ranges from 0.0 to 2.3.
- Regarding time-series portfolios:
- Gross annual Sharpe ratios are positive for all class-strategies except one (equities value).
- Gross annual Sharpe ratios averaged simply across strategies range from 0.17 for equities to 0.69 for interest rate swaps.
- Gross annual Sharpe ratios for combining across asset classes with equal volatility targets range from 0.28 for value to 1.25 for carry. Performance is consistently positive for carry and, except for very recently, for momentum. Performance for value is negative over long subperiods.
- Combined across asset classes over the entire sample period, momentum and carry correlate positively. Value correlates negatively with both carry and momentum.
- Combining across both strategies and asset classes, overall gross annual Sharpe ratio is 1.37. Three-year gross annual Sharpe ratio ranges from 0.1 to 2.7.
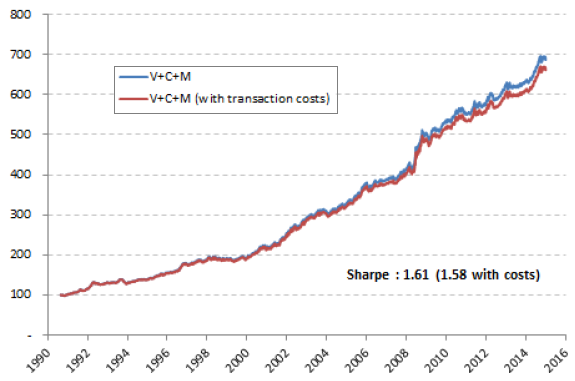
- Overall correlation between the combined cross-sectional and combined time-series portfolios is 0.43, suggesting substantial diversification benefit. Annual gross Sharpe ratio of the combined portfolios is 1.61 (see the chart below), with three-year rolling Sharpe ratio ranging from 0.5 to 2.7.
- Time-series value vastly underperforms cross-sectional value. Time-series momentum outperforms cross-sectional momentum, likely due to capture of market direction. Time-series carry works about as well as cross-sectional carry.
- Tests of all class-strategies using monthly rebalancing are broadly consistent with those for daily rebalancing.
The following chart, taken from the paper, tracks gross and net cumulative performance of the combined cross-sectional and combined time-series portfolios as described above. The authors apply a rough estimate of portfolio rebalancing (transaction) costs to construct the net trajectory.
Results indicate that the composite strategy offers attractive and steady performance over the sample period with annual gross (net) Sharpe ratio 1.61 (1.58).

In summary, evidence indicates that applying simple cross-sectional (relative) and time-series (absolute) carry, momentum and value strategies to a universe of 87 equity futures, currency exchange forwards, interest rate swaps and commodity futures offers an attractive and stable performance over the past 25 years.
Cautions regarding findings include:
- As noted in the paper, the study employs strategies known in hindsight to work well over the sample period.
- Strategy rules are complex enough to raise suspicion of original or inherited snooping bias. The authors state: “There was no fitting in this exercise, although some potentially creeps in from experience.”
- As noted in the paper, there may be survivorship/selection bias in the asset universe via avoidance of very poor performers and inclusion of markets that grew strongly.
- While described in the paper as simple, the overall strategies are likely beyond the reach of many investors, who would therefore bear fees to access them.
- The estimate of portfolio rebalancing costs is vague and may be unachievable for many investors.