How far can a fund manager squeeze turnover while still maintaining an effective low-volatility portfolio? In his June 2015 paper entitled “Low Turnover: a Virtue of Low Volatility”, Pim van Vliet investigates the lower limit of turnover for a low-volatility stock portfolio in two ways. First, he reviews 21 published analyses to relate turnover to volatility reduction while controlling for other factors. Second, he directly relates turnover and volatility reduction for an equally weighted portfolio that: (1) initially selects the 500 of 3,000 liquid global stocks with the lowest weekly volatility over the prior three years; and, (2) each subsequent month rebalances stocks that have at least doubled their baseline portfolio weight and sells stocks when they fall out of the top X% of the volatility ranking, with X varying from 20% (baseline) to 90%. He also models the costs of maintaining low-volatility stock portfolios. Using findings from 13 academic journal articles and working papers and weekly returns for the 3,000 most liquid global stocks during January 1989 through December 2013, he finds that:
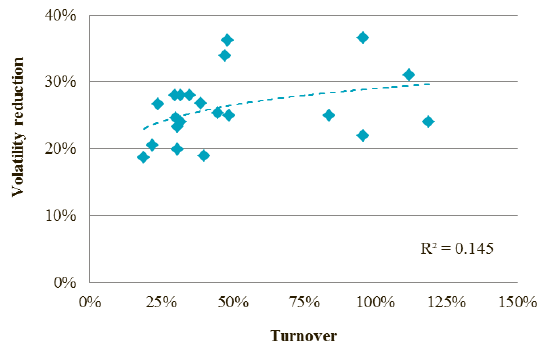
- The 21 published analyses report volatility reductions ranging from 19% to 37% and turnover ranging from 19% to 119%. There is a weak concave relationship between volatility reduction and turnover (see the chart below), but the relationship does not survive robustness tests. Overall, it appears that 25% volatility reduction is achievable with 30% turnover.
- New empirical tests show that:
- The market portfolio has an annual turnover of about 5% due to initial public offerings, delistings and reinvestment of dividends.
- The baseline low-volatility portfolio specified above produces a 28% reduction in volatility with an annual turnover of 32%.
- Sensitivity testing indicates that the first/second/third 10% increments of turnover yield 22.5%/3.5%/2.0% increments in volatility reduction.
- Low-volatility investors should be skeptical if the turnover of a low-volatility index/strategy significantly exceeds 30%. Higher turnover could derive from sector/country concentration limits and/or exposure to factors such as value and momentum.
- Because low-volatility stocks tend to have much larger capitalizations than high-volatility stocks, they also tend to be more liquid and less costly to trade.
The following scatter plot, taken from the paper, summarizes the relationship between volatility reduction (compared to the market portfolio) and turnover for 21 low-volatility portfolios in published research. Results suggest that most of the volatility reduction benefits (the cluster of points on the left) are achievable with modest turnover.

In summary, evidence from prior research and modeling suggests that 30% annual turnover should be sufficient to reduce portfolio volatility by 25% compared to a market-weighted index.
Cautions regarding findings include:
- Data/processing/capital requirements to construct and maintain a diversified low-volatility portfolio are beyond the reach of most investors. Delegating this work to a fund manager incurs fees, raising the cost of holding the portfolio.
- Testing many variations of a strategy on the same data introduces snooping bias, such that the best outcome likely overstates expectations.
- Findings may not hold for other asset classes.