Has Modern Portfolio Theory failed to deliver over the past decade because users employ long-term averages for expected returns, volatilities and correlations that do not respond to changing market environments? Do short-term estimates of these key inputs work better? In their May 2012 paper entitled “Adaptive Asset Allocation: A Primer”, Adam Butler, Michael Philbrick and Rodrigo Gordillo backtest a progression of strategies culminating in an Adaptive Asset Allocation (AAA) strategy that incorporates return predictability from relative momentum (last 120 trading days, about six months), volatility predictability from recent volatility (last 60 trading days) and pairwise correlation predictability from recent correlations (last 250 trading days). Their tests employ nine asset class indexes (U.S. stocks, European stocks, Japanese stocks, U.S. real estate investment trusts (REIT), International REITs, intermediate-term U.S. Treasuries, long-term U.S. Treasuries and commodities) and a spot gold price series. They reform portfolios monthly based on evolving return, volatility and correlation forecasts. They ignore trading frictions as negligible for “intelligent retail or institutional investors” via mutual funds or Exchange Traded Funds. Using daily returns for the nine indexes and spot gold) to test six strategies during January 1995 through March 2012, they find that:
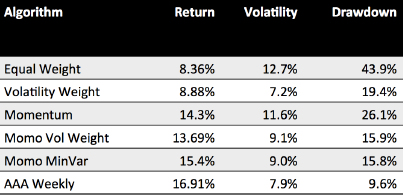
- Equal Weight: The benchmark equally weighted portfolio of all ten asset classes, rebalanced monthly, generates a gross terminal return of 303%, a gross annualized return of 8.4% and a gross annualized Sharpe ratio of 0.66.
- Volatility Weight: A portfolio that each month re-weights the ten asset classes by inverse volatility of daily returns over the past 60 trading days, scaled/overridden such that each asset contributes 1% daily volatility over this interval, generates a gross terminal return of 333%, a gross annualized return of 8.8% and a gross annualized Sharpe ratio of 1.23.
- Momentum: A portfolio that each month allocates 20% of capital to each of the top five assets based on past six-month return generates a gross terminal return of 916%, a gross annualized return of 14.3% and a gross annualized Sharpe ratio of 1.23.
- Momentum plus Volatility Weight (Momo Vol Weight): A portfolio that each month combines momentum and volatility weight as specified above generates a gross terminal return of 826%, a gross annualized return of 13.7% and a gross annualized Sharpe ratio of 1.51.
- Momentum plus Minimum Variance (Momo MinVar): A portfolio that each month combines momentum and minimum variance (combining recent volatility and pairwise correlations to produce the lowest portfolio-level volatility) generates a gross terminal return of 1,096%, a gross annualized return of 15.4% and a gross annualized Sharpe ratio of 1.71.
- Adaptive Asset Allocation (AAA): A portfolio that each week combines momentum and minimum variance, with more complex manipulation of input measurement intervals and management of portfolio volatility, generates a gross terminal return of 1,408%, a gross annualized return of 16.9% and a gross annualized Sharpe ratio of 2.15.
The following table, taken from the paper, summarizes portfolio gross return and risk statistics for the progression of strategies listed above. In general, (inverse) volatility weighting and minimum variance minimum variance suppress portfolio risk metrics and momentum enhances gross returns. Combining volatility suppression with momentum substantially boosts reward-risk ratios. Accelerating to weekly rebalancing with several kinds of optimization further boosts gross return and suppresses risk.

In summary, evidence indicates that investors may be able to enhance gross performance of multi-asset class portfolios with relatively short-term asset return, volatility and correlation forecasts.
Cautions regarding findings include:
- The sample is not large in terms of number of independent six-month momentum measurement intervals (about 34).
- The use of indexes rather than tradable assets to calculate returns does not account for any costs of creating and maintaining liquid assets that track the indexes. These costs may vary by asset class and may be material.
- Trading frictions may not be negligible for some investors, particularly for a model that involves weekly portfolio rebalancing. Frictions for currently available funds may not apply to the early part of the sample period, and declining frictions may affect strategy performance (a performance trend analysis could mitigate this concern).
- The testing of multiple strategies on the same data introduces data snooping bias, such that the best-performing strategy incorporates some luck and tends to overstate out-of-sample expectations. The specified look-back intervals for momentum, volatility and correlation calculations may involve some additional snooping bias (sensitivity tests could mitigate this concern).
- Signals and execution of associated asset rebalancings apparently coincide. The contact author reports that delaying execution by one or two days does not materially affect results.
- The ultimate AAA strategy is not clearly specified (proprietary). Investors would bear management/administrative fees to access this strategy.
See “Asset Allocation Combining Momentum, Volatility, Correlation and Crash Protection” for research with similarities and interesting contrasts.