
S&P 500 Index options data imply expected S&P 500 Index volatility (VIX) over the next month. In turn, VIX futures options data imply expected volatility of VIX (VVIX) over the next month. Does VVIX predict stock index option and VIX option returns? In their September 2014 paper entitled “Volatility-of-Volatility Risk”, Darien Huang and Ivan Shaliastovich investigate whether VVIX represents a time-varying risk affecting: (1) S&P 500 Index option returns above and beyond the risk represented by VIX; and (2) VIX futures option returns. They measure risk effects via returns on S&P 500 Index options hedged daily by shorting the S&P 500 Index and VIX futures options hedged daily by shorting VIX futures. Using monthly S&P 500 Index returns, VIX futures returns, VIX, VVIX, S&P 500 Index option prices and VIX option prices during February 2006 through June 2013, they find that:
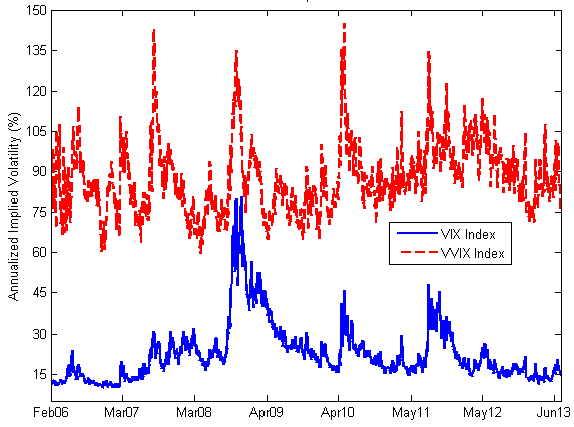
- VIX and VVIX exhibit different dynamics (see the chart below):
- The average level of the VIX (VVIX) is about 24% (87%), demonstrating that VIX futures returns are far more volatile than S&P 500 Index returns.
- The monthly correlation between VIX and VVIX is only 0.30.
- While VIX and VVIX have some common peaks (most notably during the 2008 financial crisis), VVIX reacts much more strongly than VIX at other times of distress (May 2010 Eurozone debt crisis and flash crash, August 2011 U.S. debt ceiling crisis).
- On average VIX is greater than but closely related to actual (realized) S&P 500 Index returns, and VVIX is greater than but related to realized VIX futures returns:
- Annualized S&P 500 Index return volatility is 17.6%. The correlation between realized S&P 500 Index volatility and VIX (VVIX) is 0.88 (only 0.32).
- Annualized VIX futures return volatility is 73.4%. The correlation between VIX futures volatility and VIX (VVIX) is 0.38 (0.53).
- VIX (VVIX) significantly predicts S&P 500 Index (VIX futures) realized volatility.
- On average, hedged S&P 500 Index option and VIX futures option returns are negative, suggesting that investors are willing to pay for protection against both volatility and volatility of volatility.
- Average monthly returns on hedged VIX futures options are significantly negative for all strikes except out-of-the-money puts, for which significance is marginal. For call options, the average monthly loss is -0.57% (-1.41%) of the index for in-the-money (out-of-the-money) contracts.
- Hedged S&P 500 Index options and hedged VIX futures options with higher sensitivities to volatility-of-volatility risk generate more negative returns.
- Higher values of VVIX predict more negative returns for both hedged S&P 500 Index options and hedged VIX futures options.
The following chart, taken from the paper, compares VIX and VVIX over the sample period. The chart shows that expected stock market volatility-of-volatility is much higher than, and only loosely related to, expected stock market volatility itself.
In summary, evidence indicates that investors may be able to exploit usually negative volatility and volatility-of-volatility risk premiums by selling S&P 500 Index options and VIX futures options, and they can refine this strategy by focusing on the moneyness alternatives and VIX/VVIX conditions that carry the highest premiums.
Cautions regarding findings include:
- Analysis methods in the paper are complex, beyond the reach of many investors.
- Outcome estimates are gross, not net. Including the costs of initiating and closing positions and of daily hedge rebalancing would reduce reported premiums.
- The paper does not explore any strategies for capturing the volatility and volatility-of-volatility premiums. Strategy volatility and non-normality may inhibit exploitation.
See “VVIX as a Return Indicator?” for investigation of the usefulness of VVIX as a stock market and VIX futures proxy return indicator.
Frequently Asked Questions
What is VVIX and what does it measure in the options market?
VVIX is the expected volatility of the VIX over the next month, derived from VIX futures options prices. Because the VIX itself is the expected S&P 500 Index volatility implied by S&P 500 options, VVIX is effectively a measure of volatility-of-volatility. In the study's February 2006–June 2013 sample, VVIX averaged about 87% versus about 24% for the VIX.
Does a higher VVIX predict worse returns for S&P 500 and VIX options?
Yes, higher VVIX values predicted more negative returns for both daily-hedged S&P 500 Index options and daily-hedged VIX futures options in the February 2006–June 2013 sample. Hedged VIX futures call options lost an average of -0.57% per month (in-the-money) to -1.41% per month (out-of-the-money) of the index. This suggests investors pay a premium for protection against volatility-of-volatility risk, though the results are gross of costs.
How are hedged option returns used to test volatility-of-volatility risk?
The study measures risk effects using monthly returns on S&P 500 Index options hedged daily by shorting the S&P 500 Index, and VIX futures options hedged daily by shorting VIX futures. It relates these hedged returns to VIX and VVIX levels and to option sensitivity to volatility-of-volatility risk, using data from February 2006 through June 2013. Options with higher sensitivity to this risk generated more negative returns.
Is VVIX the same as the VIX, and how do they differ?
No, VVIX and the VIX are different measures with different dynamics: the monthly correlation between them was only 0.30 in the February 2006–June 2013 sample. The VIX gauges expected S&P 500 volatility, while VVIX gauges expected volatility of the VIX, and it averaged about 87% versus 24% for the VIX. VVIX reacted much more strongly than the VIX during the May 2010 Eurozone crisis and flash crash and the August 2011 debt ceiling crisis.
What are the limitations of selling options to earn the volatility-of-volatility premium?
The reported premiums are gross, not net, so costs of opening and closing positions and of daily hedge rebalancing would reduce them. The paper's analysis methods are complex and beyond the reach of many investors, and it does not explore specific strategies for capturing the premiums. Strategy volatility and non-normality of returns may also inhibit exploitation.