Are option traders market leaders, such that information gleaned from options trading anticipates equity returns? In the December 2011 draft of their paper entitled “Exploiting Option Information in the Equity Market”, Guido Baltussen, Bart Van der Grient, Wilma De Groot, Weili Zhou and Erik Hennink examine whether information publicly available from the option market exploitably predicts returns for individual U.S. stocks. Specifically, they investigate the separate and combined information value of four at-the-money (ATM) and out-of-the-money (OTM) equity option trading metrics:
- OTM Skew: the difference in implied volatilities between OTM puts and ATM calls.
- RV-IV: the difference between realized volatility over the past 20 trading days (RV) and implied volatility (IV).
- ATM Skew: the difference in implied volatilities between ATM puts and ATM calls.
- Change in ATM Skew.
They define an option as ATM (OTM) when the ratio of strike price to stock price is between 0.95 and 1.05 (0.80 and 0.95). They reform equally-weighted quintile sort test portfolios weekly based on Tuesday closes for each metric, with a one-day lag (implementing with Wednesday closing data). Using daily total returns, market capitalizations and options trading data for those of the 1,250 largest stocks in the S&P/Citigroup U.S. Broad Market Index with sufficient options data during January 1996 through October 2009, they find that:
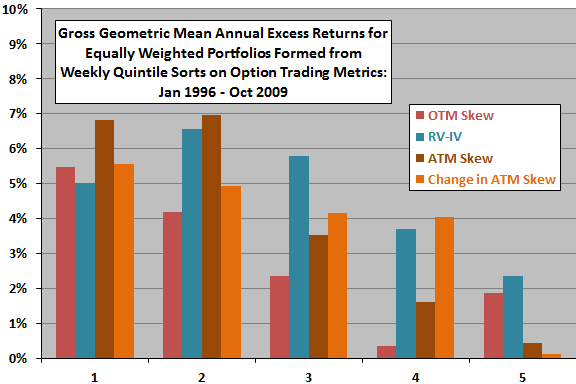
- All four individual option trading metrics separately predict gross returns and alphas for underlying stocks (see the first chart below). Return patterns are materially distinct, suggesting diversification benefits in combination.
- A combination constructed as the simple average of normalized individual metrics, implemented as a long-short strategy with extreme quintiles, generates an average gross annual return of 9.9% (mostly from the long side).
- Gross profitability is robust over bull, bear, volatile and calm markets and is at least as strong when limited to the 100 largest U.S. stocks.
- Exploitation based on weekly portfolio reformation generates very high turnover, such that reasonable transaction costs more than offset gross profits. However:
- A long-short strategy using the combined metrics and limited to the 100 largest stocks, with gross annual profit of 13.6% and estimated one-way trading friction of 0.07% (for large trades), generates an average net annual return of 2.4%.
- A modified strategy that suppresses turnover enhances net profitabity. This strategy initially selects stocks based on the combined metrics as above, but holds them until they migrate to the extreme opposite quintile. When stocks fall out of the portfolio, the strategy substitutes the most attractive (for long positions) or least attractive (for short positions) stock not already in the portfolio. Applied to the 100 largest stocks, this modified strategy generates an average net annual return of 7.6%.
- Net returns of the above long-short strategies ignore any shorting costs, estimated at 0.5% to 1.0% annually.
The following chart, constructed from data in the paper, shows gross geometric mean annual excess returns (relative to the risk-free rate) of equally weighted portfolios formed from weekly quintile sorts of the specified U.S. large-cap stock universe over the entire sample period for each of the above four option trading metrics. Quintile 1 (5) contains the stocks with the lowest (highest) values of each metric, corresponding to the highest (lowest) expected return.
While progressions across quintiles are not perfectly systematic, results indicate that all four option metrics convey information about future returns of underlying stocks.

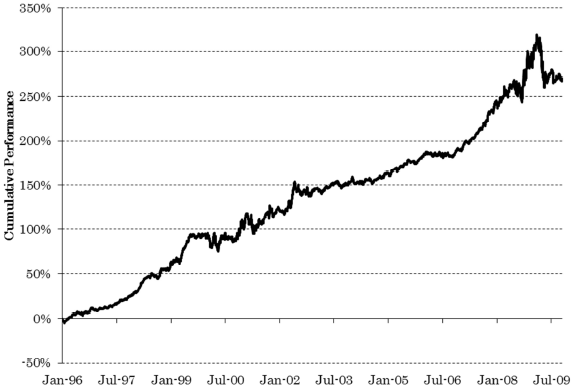
The next chart, taken from the paper, depicts the cumulative gross performance of the long-short strategy based on the four-metric combination strategy applied to the specified U.S. large-cap stock universe over the entire sample period (without trading suppression). The strategy generally produces stable gross returns over time, even after publication of studies on individual metric anomalies.

In summary, evidence indicates that equity option traders anticipate movements in underlying assets to a degree potentially exploitable among the largest, most liquid stocks.
Cautions regarding findings include:
- The complexity of the net profitable strategies with respect to sample preparation, subsample selection and trading rules suggests the possibility of snooping bias.
- Many investors may not be able to achieve the low levels of estimated trading friction and shorting costs used to assess net profitability.
- Data acquisition/processing costs may be material for many investors.