Is there a reliable way to forecast spikes in U.S. stock market expected volatility, as measured by the CBOE Volatility Index (VIX), and thereby avoid or exploit associated market declines? In his April 2017 paper entitled “Forecasting a Volatility Tsunami”, Andrew Thrasher examines several calm-before-the-storm signals for predicting spikes in VIX, which he defines as a 30% advance from a close to an intraday high within five trading days. The signals considers are:
- VIX at a 4-week low.
- Decline in VIX by at least 15% over three trading days.
- Standard deviation (volatility) of VIX during the last 20 trading days at or below the 15th percentile of the full-sample distribution of its 20-day standard deviations for the first time in at least 10 trading days.
- Standard deviation (volatility) of CBOE VVIX (expected volatility of VIX during the next month) during the last 20 trading days at or below the 15th percentile of the full-sample distribution of its 20-day standard deviations for the first time in at least 10 trading days.
- Both signals 3 and 4.
Using daily VIX and VVIX levels during late May 2006 through June 2016, he finds that:
- There have been 70 occurrences of the specified VIX spikes during the full sample period.
- Neither signals 1 nor 2 above effectively warn investors of VIX spikes.
- After 4-week lows, VIX often trends lower without any spike.
- Sharp declines of at least 15% better forecast VIX spikes than 4-week lows, but still include many false signals.
- Charts displaying VIX and signals from methods 3 and 5 suggest these signals are better predictors of VIX spikes than signals 1 and 2.
- For signal 3, there are few instances of signals not followed by a VIX spike. However, not every spike is preceded by a signal.
- Signal 4 generates many false signals.
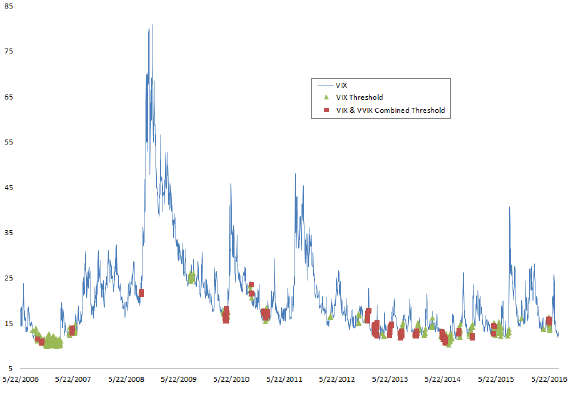
- Combination signals 5 appear to be timely precursors of VIX spikes (see the chart below).
The following chart, taken from the paper, tracks VIX and shows signal 3 (VIX Threshold) and combined signals 5 (VIX & VVIX Combined Threshold) as specified above. Results suggest that these signals warn of some, but not all, VIX spikes. However, signals tend to cluster (confounding crisp response), and there appears to be no fixed interval between signal and VIX spike (confounding all-clear responses).
In summary, evidence suggests that, “as the seas become calm and the tide pulls back in the ocean before a massive wave, so too does volatility’s [VIX’s] dispersion narrow [volatility decline] before an eventual spike higher.”
Cautions regarding findings include:
- Low-volatility thresholds for VIX and VVIX are set in-sample, thereby incorporating look-ahead bias. Said differently, an investor operating in real time during the sample period could not do the analysis.
- Testing multiple signals on the same data introduces snooping bias, exaggerating the predictive power of the best-performing signal.
- Signals involving multiple parameters (size/interval of VIX spike, lookback interval for standard deviation measurement, signal threshold for standard deviation, requirement of no signal during another lookback interval, forward signal effectiveness determination interval) are subject to multiple opportunities for snooping of parameter settings.
- Using intraday highs and lows to measure changes in VIX within intervals is misleading (non-exploitable) because these highs and lows occur at unpredictable times and are not observable until past. In other words, an investor would need perfect foresight to exploit them.
- The author does not devise or test any trading strategies based on findings, which would require not only a warning signal but also an all-clear signal.
- Predicting VIX may not translate to a profitable trading strategy for the broad stock market (see “VVIX as a Return Indicator?”, “Expected Volatility of Stock Market Volatility as a Predictor” and “Volatility of Volatility as Stock Market Return Predictor”) or for VIX futures, which behave differently from VIX (see “Exploit Short-term VIX Reversion with VXX?”).
- The standard deviation of VVIX translates to the realized volatility of the expected volatility of S&P 500 Index returns over the next month. This triple-iterated volatility seems far removed from the thinking of investors.
- CBOE introduced VVIX in March 2012, so there is no feedback to financial markets based on this index before that time. Its active tracking since may have affected stock market volatility behavior.