Are there times when investors should avoid low-volatility stocks? In their August 2014 paper entitled “Tactical Timing of Low Volatility Equity Strategies”, Sanne De Boer and James Norman investigate which factors predict the performance of low-volatility stocks relative to a capitalization-weighted index globally since 1980. They focus on two concerns: (1) will low-volatility stocks perform poorly when they are relatively expensive compared to the rest of the market; and, (2) will low-volatility stocks, which tend to pay high dividends, underperform when interest rates rise. Their low-volatility portfolio is a capitalization-weighted collection of country sectors processed quarterly in three steps designed to achieve a balance of low risk and sufficient diversification. They do not account for quarterly portfolio reformation frictions in return calculations. Using weekly data for all country sectors included in the MSCI Developed Markets Index during January 1975 through March 2014, they find that:
- Based on gross annualized Sharpe ratio, the low-volatility portfolio outperforms the broad capitalization-weighted index since 1980 and over the last 10, five and three years (but not over the last year). During the third of months when the broad index performs best (worst), the low-volatility portfolio exhibits 74% (57%) upside (downside) capture.
- Low-volatility portfolio valuation levels relative to the broad market (dividend yield, book-to-market ratio and earnings yield spreads) do not predict relative performance of low-volatility stocks.
- Some market environment and macroeconomic indicators exhibit mild predictive power for the relative performance of low-volatility stocks (see the chart below). Most notably:
- High volatility of recent monthly portfolio returns indicates a headwind for the low-volatility portfolio.
- High real annual GDP growth indicates a tailwind for the low-volatility portfolio.
- While performance of the low-volatility portfolio is more sensitive to interest rate changes than the broad capitalization-weighted index, their gross Sharpe ratios in rising-rates environments are similar.
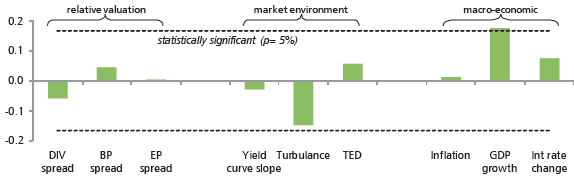
The following chart, taken from the paper, summarizes correlations between quarterly values of the following nine indicators and next-quarter low-volatility excess return relative to the broad capitalization-weighted market over the entire sample period.
- DIV spread: difference between a standardized, weighted average dividend yield of country sectors in the low-volatility portfolio and the dividend yield of the broad capitalization-weighted index.
- BP spread: difference between a standardized, weighted average book-to-market price ratio of country sectors in the low-volatility portfolio and the book-to-market price ratio of the broad capitalization-weighted index.
- EP spread: difference between a standardized, weighted average earnings-to-market price ratio of country sectors in the low-volatility portfolio and the earnings-to-market price ratio of the broad capitalization-weighted index.
- Yield curve slope: difference between the Barclays Global Aggregate bond index yield (10-year U.S. Treasury note yield prior to 1991) and the 3-month U.S. Treasury bill yield.
- Turbulence: volatility of monthly pooled country sectors returns over the past six months.
- TED spread (credit risk): difference between 3-month U.S. LIBOR rate and the 3-month U.S. Treasury bill yield.
- Inflation: annual OECD inflation lagged by one month.
- GDP growth: annual real OECD GDP growth lagged by one quarter, with adjustments for non-OECD countries.
- Interest rate change: annual change in Barclays Global Aggregate bond index yield (10-year U.S. Treasury note yield prior to 1991).
Dashed lines indicate 95% confidence levels for significance. The strongest indications are that country sector volatility relates negatively to future low-volatility portfolio returns and real global GDP growth relates positively to future low-volatility portfolio returns.
In summary, evidence indicates that rising interest rates and (especially) high valuations relative to the broad equity market are not significant concerns for global low-volatility equity portfolios.
Cautions regarding findings include:
- Performance data are gross, not net. Including the costs of quarterly portfolio reformation would reduce reported performance. Portfolio reformation frictions may be higher for the low-volatility portfolio than for the broad market index, such that net findings would differ from gross findings. However, the corresponding author reports that: “The portfolios were inherently liquid but we have found that this [80% annual] turnover can be brought down significantly (for instance, by adding trade friction to portfolio rebalancing) with minimal impact to the gross historical risk-adjusted performance.”
- Testing many potentially predictive indicators against the same set of return data introduces data snooping bias, such that results for the strongest indicators overstate their expected predictive power.
- Construction rules for the low-volatility portfolio appear complex enough to admit material snooping bias in the rule selection process.