A subscriber suggested applying simple momentum trading strategies to a set of leveraged equity style (size, value-growth) funds. It seems plausible that leverage may make funds react quickly and strongly to business cycle shifts that affect style performance. However, the costs of maintaining leverage are countervailing. Historical data for leveraged style funds is very limited, so we test instead a set of seven ProFunds 1.5X leveraged sector mutual funds, all of which have trading data back at least as far as December 2000:
ProFunds UltraSector Oil & Gas Inv (ENPIX)
ProFunds UltraSector Financials Inv (FNPIX)
ProFunds UltraSector Health Care Inv (HCPIX)
ProFunds Real Estate UltraSector Inv (REPIX)
ProFunds Telecom UltraSector Inv (TCPIX)
ProFunds Technology UltraSector Inv (TEPIX)
ProFunds Utilities UltraSector Inv (UTPIX)
As in “Simple Sector ETF Momentum Strategy Performance” and “Doing Momentum with Style (ETFs)”, we consider a basic momentum strategy that allocates all funds at the end of each month to the mutual fund with the highest total return over the past six months (6-1). We also consider a more cautious strategy that allocates all funds at the end of each month either to the mutual fund with the highest total return over the past six months or to cash depending on whether the S&P 500 Index is above or below its 10-month simple moving average (6-1;SMA10). Using monthly adjusted closing prices for the seven leveraged sector funds, the S&P 500 index, 3-month Treasury bills (T-bills) and S&P Depository Receipts (SPY) over the period December 2000 through November 2011 (132 months), we find that:
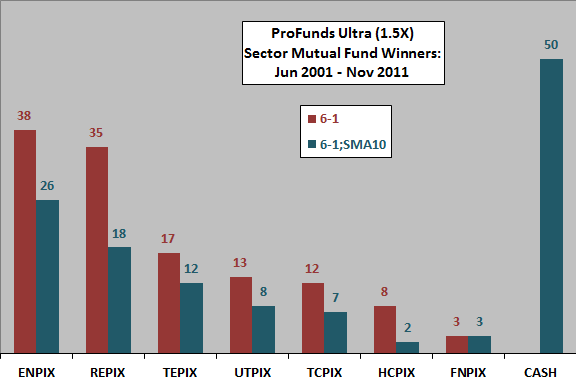
The following chart shows the distribution of leveraged sector mutual fund winners based on past six-month total return over the entire sample period for both the 6-1 and 6-1;SMA10 momentum strategies. For the latter, the strategy is in cash 38% of the time.
How does applying the strategies to these top-ranked funds translate into cumulative returns?

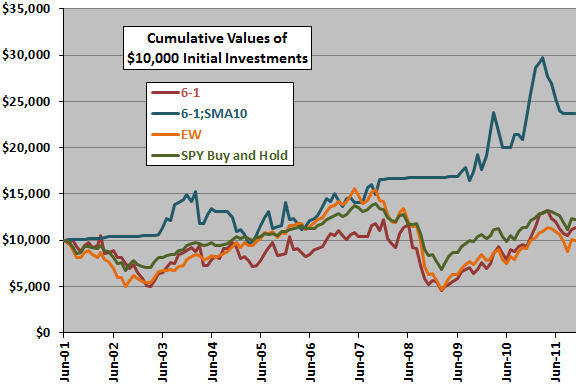
The next chart compares the cumulative values over the sample period of $10,000 initial investments in: the two leveraged sector mutual fund momentum strategies; an equally weighted and monthly rebalanced portfolio of the seven mutual funds (EW); and, SPY. Calculations derive from the following assumptions:
- Reallocate at the close on the last trading day of each month (assume we can estimate six-month past total returns for the mutual funds based on prior-day closes and S&P 500 Index SMA crossing signals just before the concurrent close).
- Per the ProFunds fund exchange policy, there are no trading frictions.
- Return on cash for the 6-1;SMA10 variation is equal to the T-bill yield at the time of allocation.
- Ignore any tax implications of trading.
The 6-1 momentum strategy mostly underperforms buying and holding SPY and is no better than an equal-weighted portfolio of the seven funds (EW). The 6-1;SMA10 strategy generally outperforms SPY by avoiding major market downturns. The 6-1;SMA10 strategy less consistently outperforms a simple strategy of investing in SPY or cash according to the SMA10 signal (not shown).
How do average monthly returns, as alternative measures of strategy performance, compare?

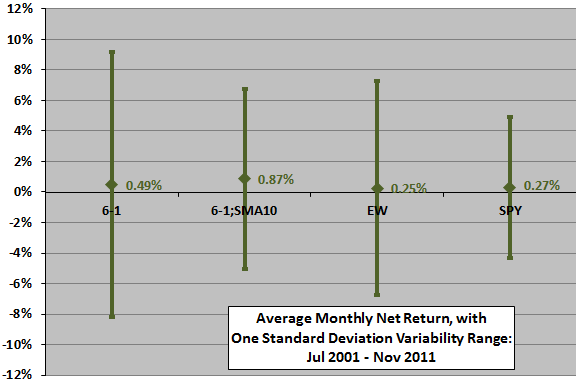
The final chart depicts average monthly returns and standard deviations of monthly returns for the two leveraged sector mutual fund momentum strategies, an equal-weighted portfolio of the funds and buying and holding SPY over the entire sample period. The 6-1;SMA10 variation has the highest average monthly return with relatively low volatility (because of frequent allocation to cash).

In summary, evidence from simple tests indicates that a basic leveraged sector mutual fund momentum strategy has mostly underperformed the broad stock market over the past 13 years. Combining such a strategy with a simple moving average signal for entering and exiting stocks may be attractive.
Cautions regarding findings include:
- Sample size is modest (just 22 independent six-month momentum ranking intervals and only 13 independent 10-month SMA intervals).
- The assumption of concurrent momentum measurements and trading is riskier for mutual funds than exchange-traded funds because prices for the former are available only for the close.
- The selected fund ranking interval derives from prior academic studies. This prior research may impound (and therefore transmit) data snooping bias, which is especially pernicious for small samples. Ranking intervals other than six months and holding periods other than one month may produce different results. Optimizing the ranking and holding intervals would elevate data snooping bias.
- Lengthy holding periods for leveraged funds are problematic (see “Multi-year Performance of Leveraged ETFs” as linked above, plus “Multi-year Performance of Non-equity Leveraged ETFs”, “Unintended Characteristics of Leveraged and Inverse ETFs” and “Performance of Leveraged ETFs over Extended Holding Periods”). Using funds with leverage higher than 1.5X may change results, perhaps detrimentally for a simple momentum strategy but possibly advantageously in combination with an SMA rule.
- Including more sector/asset class funds may enhance results, but also may not.
- Potential wildness in leveraged fund monthly return distributions limits confidence in results.