Does a willingness to pay more or less for options than indicated by recent actual levels of stock return volatility reflect the current level of investor/trader risk aversion? In other words, does the gap between option-implied and historical stock return volatilities provide a tradable measure of fearfulness? In the September 2006 draft of their paper entitled “Expected Stock Returns and Variance Risk Premia”, Tim Bollerslev, George Tauchen and Hao Zhou investigate the predictive power of the implied-historical volatility gap for future stock returns. Using monthly data for the S&P 500 index (VIX for implied volatility and a summation of five-minute squared returns for historical volatility) for the period 1990-2005, they find that:
- A large (small) gap between implied and historical volatilities predicts high (low) future stock returns.
- This gap explains over 15% of the variation in quarterly excess returns for the overall stock market during 1990-2005, easily beating the predictive power of the price-earnings ratio (P/E), the price-dividend ratio and other commonly used indicators.
- A combination of the implied-historical volatility gap and P/E predicts over 26% of the quarterly variation in stock market returns.
- Both the level of risk and the level of risk aversion affect stock market returns. The implied-historical volatility gap measures risk aversion.
- The gap between implied and historical volatilities relates negatively to future GDP growth. A high level of risk aversion indicates a coming decrease in economic growth.
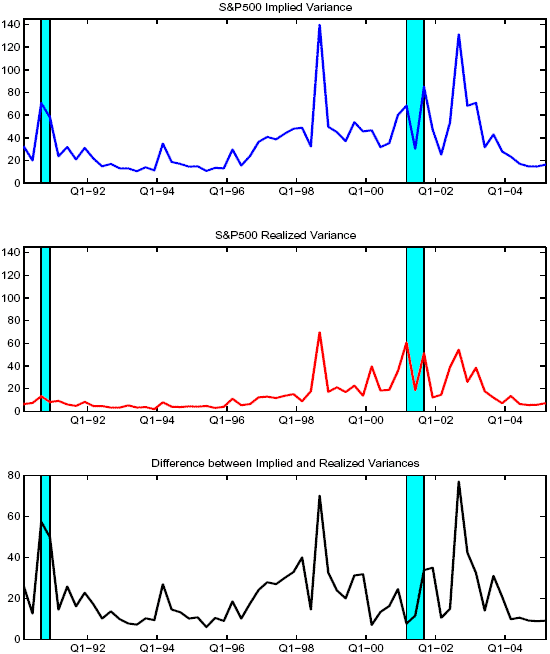
The following chart, taken from the paper, shows first graphs of the implied and historical variances (volatilities) of the S&P 500 index on a quarterly basis over the period 1990-2005. It then shows the difference between these two graphs, representing a measure of equity investor/trader risk aversion. When risk aversion is high (low), stock prices are presumably depressed (elevated) and future returns therefore promising (unpromising). The light blue rectangles indicate recessions. The authors identify the 1998 and 2002 peaks with the Russian debt/LTCM crises and prominent corporate accounting scandals, respectively.

In summary, when investors/traders are depressed, as measured by the gap between implied volatility and historical volatility, so are stock prices.
See the CBOE Trading Tools for similar current implied and historical volatility data. Note that the authors emphasize the importance of calculating historical volatility using high-frequency intraday (five-minute) data.