An array of leveraged exchange-traded funds (ETF) track short-term (daily) changes in commodity and currency exchange indexes. Over longer holding periods, these ETFs tend to veer off track. The cumulative veer can be large. How do leveraged ETFs perform over a multi-year period? What factors contribute to their failure to track underlying indexes? To investigate, we consider a set of 12 ProShares 2X leveraged index ETFs (six matched long-short pairs), involving a commodity index, oil, gold, silver and the euro-dollar and yen-dollar exchange rates, with the start date of 12/9/08 determined by inception of the youngest of these funds (Ultra Yen). Using daily dividend-adjusted prices for these funds over the period 12/9/08 through 11/4/11 (almost three years), we find that:
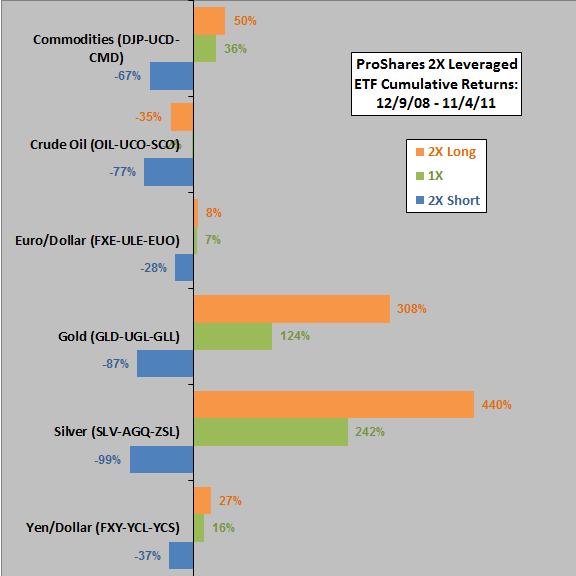
The following chart summarizes cumulative returns for all six pairs of 2X ETFs, along with those of comparable 1X long ETFs, from 12/9/08 through 11/4/11. Tracking performance of the leveraged funds varies considerably across underlying assets.
What are the relationships between cumulative returns for the 2X ETFs and cumulative returns for the comparable 1X long ETFs at the end of the sample period?

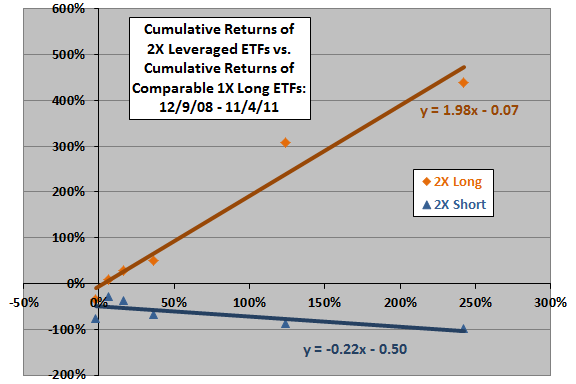
The next chart relates the cumulative returns of the 2X long and 2X short ETFs to those of comparable 1X long ETFs at the end of the sample period. Results indicate that:
Cumulative returns of 2X long ETFs appear to map to those of their 1X long counterparts systematically, with the realized leverage (slope) as of 11/4/11 +1.98 (very close to the targeted leverage of 2). There is a performance penalty (y-intercept) of 7% across all 2X long funds over the sample period.
Cumulative returns of 2X short ETFs also appear to map to to those of their 1X long counterparts, but the realized leverage (slope) as of 11/4/11 is -0.22 instead of -2. Also, there is a performance penalty (y-intercept) of 50% across all 2X short funds.
In other words, over the three-year sample period, targeting leverage on a daily basis tends to be costly on the short side.
Note that these results and those above depend on the specific return path during the sample period. Results for another period of equal length could be substantially different.
Note also that ProShares states: “Due to the compounding of daily returns, ProShares’ returns over periods other than one day will likely differ in amount and possibly direction from the target return for the same period.”
How do cumulative returns of leveraged ETFs relate to their volatility?

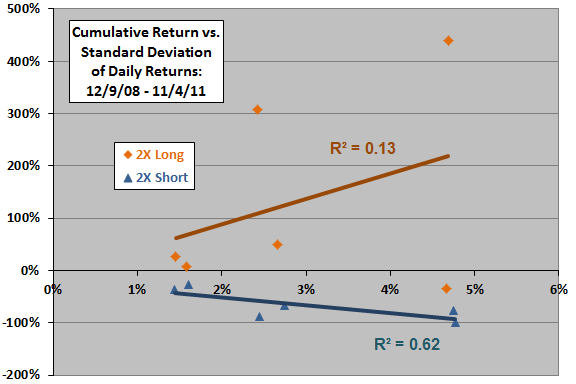
The final chart relates the cumulative returns of the 2X long and 2X short ETFs to their individual volatilities (standard deviations of daily returns) over the sample period.
Results for the 2X long ETFs are highly scattered (unreliable), with a positive slope and relatively low R-squared statistic.
Results for the 2X short ETFs appear to be systematic, with a negative slope and R-squared statistic 0.62, indicating that variation in volatility explains 62% of the variation in cumulative returns. In other words, the grind of targeting daily leverage escalates with volatility.
Results for the 2X short (but not the 2X long) ETFs are generally in line with the “Volatility in Perspective” discussion offered by ProShares, which relates leveraged ETF performance to volatility of the underlying index.

In summary, evidence from simple tests confirms that the multi-year performances of 2X long and 2X short commodity and currency exchange ETFs can deviate considerably from daily leverage targets.
Cautions regarding findings include:
- The sample period is not long in terms of number of market regimes relevant to outcomes. Outcomes for this timescale clearly depend on starting point.
- The number of funds sampled is small, so group statistics have low reliability.
- Leverage may amplify return distribution wildness, such that “normal” statistical measures lose meaning.