Are investors/traders irrationally attracted to stocks that have recently acted like winning lottery tickets? In their August 2008 paper entitled “Maxing Out: Stocks as Lotteries and the Cross-Section of Expected Returns”, Turan Bali, Nusret Cakici and Robert Whitelaw investigate the significance of extreme positive past daily returns for future returns. Specifically, they examine next-month returns for stocks sorted by maximum daily return during the past month. Using daily and monthly returns, and contemporaneous firm characteristics, for a broad sample of stocks over the period July 1962 thorough December 2005, they conclude that:
- There is a significantly negative relationship between maximum daily return during the past month and return over the next month.
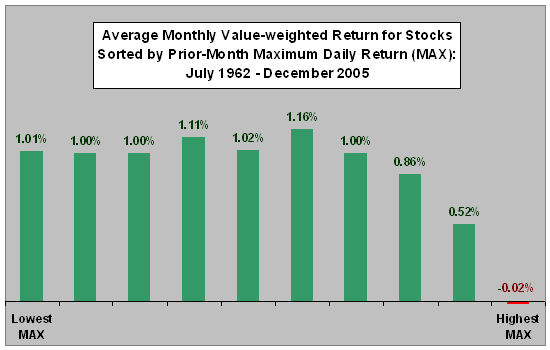
- A hedge portfolio that is long (short) the 10% of stocks with the lowest (highest) daily maximum returns over the past month, rebalanced monthly, generates an average value-weighted raw return of 1.03% per month before trading frictions. The corresponding four-factor (market, size, book-to-market and momentum) alpha is 1.18%.
- Results are robust to firm fundamentals and technical trading behaviors.
- Stocks with extreme positive returns tend to be small and illiquid (suggesting high trading frictions that may seriously dent hedge returns), with high returns in the formation month and low returns over the prior 11 months.
- After controlling for stocks with extreme positive past daily returns, the expected returns on stocks with high past idiosyncratic are abnormally high (rather than puzzlingly low.
- There is weaker and less consistent evidence that stocks with extreme negative daily returns during the past month tend to outperform the next month.
The following chart, constructed from data in the paper, shows the average monthly returns (before trading frictions) for ten value-weighted portfolios reformed every month from July 1962 to December 2005 by sorting stocks on maximum daily return (MAX) during the past month. It shows that portfolios of stocks with extreme positive past daily returns tend to underperform and that the effect is concentrated among about 30% of stocks. The effect is still present, but less pronounced, for equal-weighted portfolios.

In summary, evidence suggests investors/traders tend to overpay for stocks with recent extreme positive daily returns, and these stocks therefore subsequently tend to underperform.
While trading frictions may preclude direct exploitation of this effect, it does suggest avoiding jumpy stocks.