Is risk avoidance by itself a good tactical asset allocation strategy? In their November 2011 paper entitled “A Risk Based Approach to Tactical Asset Allocation”, Dario Brandolini and Stefano Colucci propose a purely risk-based asset allocation framework designed to buffer effects of volatility clusters. Their critical allocation variable is expected shortfall, estimated each week to adjust the allocation for each asset in the portfolio separately. They test their framework on the following (U.S. dollar-denominated) indexes as proxies for portfolio assets: S&P 500 Index, TOPIX, DAX, MSCI UK, MSCI France, Italy Comit Globale, MSCI Canada, MSCI Emerging Markets, Reuters-Jefferies CRB and Merril Lynch U.S. Treasuries (7-10 years). They assume strategic allocations of 70% to equities (scaled by market according to GDP as measured every five years), 10% to commodities and 20% to U.S. Treasuries. They shift the allocation for each equities/commodities asset partially to a risk-free alternative (U.S. treasuries or cash) to the degree its one-month expected shortfall for the worst 5% of observations falls below a target of -6%. They assume rebalancing occurs simultaneously with signals and impose top-down annual total expense ratios of 2% for active reallocation and 0.6% for a comparable passive but diversified portfolio. Using daily total returns as available (mostly since the late 1980s) and capital gains only before then for the ten indexes during 1974 through 1999 for calibration and 2000 through most of August 2011 for out-of-sample testing, they find that:
- The stable expected shortfall asset allocation framework improves out-of-sample (since 2000) gross risk-adjusted returns for every asset class considered (for example, see first chart below).
- For the diversified portfolio since 2000, the active framework (see the second chart below):
- Generates equity-like returns with lower volatility and drawdown.
- Experiences only one net annual loss (2002, -4.8%), compared to four (including partial 2011) for the comparable passive portfolio.
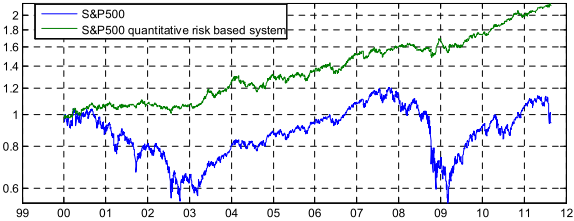
The following chart, taken from the paper, shows the gross cumulative performance of the stable expected shortfall asset allocation framework as applied to the S&P 500 Index (S&P 500 quantitative risk based system) during January 2000 through most of August 2011. For comparison it also shows the gross return for buying and holding the S&P 500 Index. Results indicate that resistance of the framework to downturns generates fairly consistent outperformance with low volatility.
Results for other indexes tested are generally similar, with varying degrees of gross risk-adjusted outperformance relative to buying and holding the index.

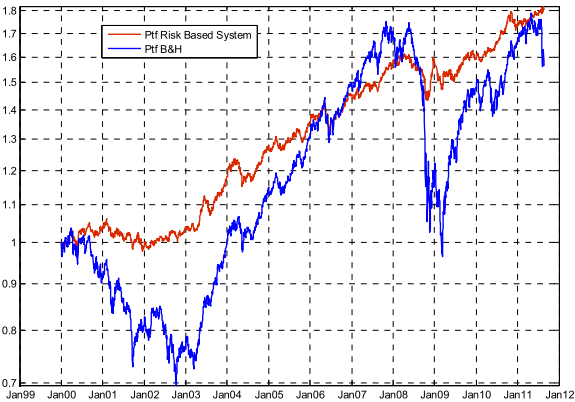
The next chart, also from the paper compares the net portfolio-level performances of the stable expected shortfall asset allocation framework (Ptf Risk Based System) and a comparable passive portfolio (Ptf B&H) during January 2000 through most of August 2011. Calculations assume an annual total expense ratio of 2% for the active framework and 0.6% for the passive benchmark.
Results indicate that the active framework beats the comparable passive strategy at most horizons, with much lower volatility and very limited drawdowns.

In summary, evidence indicates that the purely risk-based stable expected shortfall tactical asset allocation framework may improve net risk-adjusted performance by limiting exposure to left tails of component asset return distributions as generated by volatility clustering.
Cautions regarding findings include:
- Although the authors present their strategy as “simple,” many investors would likely find reallocating multiple assets weekly based on recalculations of expected shortfall and value at risk complex and difficult to implement concurrently with trading at market closes.
- The out-of-sample test period is substantially favorable to long-only market timing (see “The 2000s: A Market Timer’s Decade?”) and may not be representative of the long run.
- Although the authors present their strategy as “non-optimized,” the specific expected shortfall target and the allocation specification involving expected shortfall and value at risk may impound data snooping bias.
- Per one of the authors, the 2% annual total expense ratio assumed for the active strategy consists of about 0.7% for trading frictions and 1.3% for management fees. Even the total of 2% annually may be unrealistically low for costs of weekly rebalancing a relatively small portfolio holding ten assets.
- Tracking errors between tradable assets available for real portfolios and indexes may materially affect results.