A subscriber suggested review of Empiritrage’s Volatility-Based Allocation (VBA). This strategy applies two monthly signals to an equally weighted portfolio of asset class total return proxies to determine whether to be in each proxy or cash, as follows:
- Step 1: If the 10-day simple moving average (SMA) of the S&P 500 Volatility Index (VIX) is above its 30-day SMA (risk off), substitute the risk-free asset for all asset class proxies.
- Step 2: If the 10-day simple moving average (SMA) of VIX is below its 30-day SMA (risk on), invest in each asset class proxy for which the respective two-month SMA is above the 12-month SMA, and otherwise in the risk-free asset.
Empiritrage’s simulation of VBA employs equal allocations each month to each of five asset class proxies (U.S. stocks, non-U.S. developed market stocks, emerging market stocks, real estate and long-term U.S. government bonds) or to U.S. Treasury bills (T-bills) as signaled, ignoring trading frictions, during March 1986 through August 2012. They find that VBA “dominates” an allocation based only on individual asset class proxy SMAs. However, indexes do not account for the costs of maintaining tradable assets, and the costs of switching between risk assets and cash may be material. For another perspective, we replicate VBA (with switching frictions) using the following exchange-traded funds (ETF) and estimated return on cash:
SPDR S&P 500 (SPY)
iShares MSCI EAFE Index (EFA)
iShares MSCI Emerging Markets Index (EEM)
SPDR Dow Jones REIT (RWR)
iShares Barclays 20+ Year Treasury Bond (TLT)
3-month Treasury bills (risk-free rate)
Using daily closes for VIX since March 2003 and monthly closes for the ETFs and risk-free rate since April 2003 (limited by inception of EEM), we find that:
Portfolio performance calculations assume:
- We can estimate VIX and ETF SMAs just before the close on the last trading day of each month and reallocate at that same close. This assumption may be problematic when SMAs are close in value.
- Monthly rebalancing of portfolios to equal weights is frictionless, but switching between ETFs and cash bears a friction of 0.1%.
- Ignore tax implications of trading.
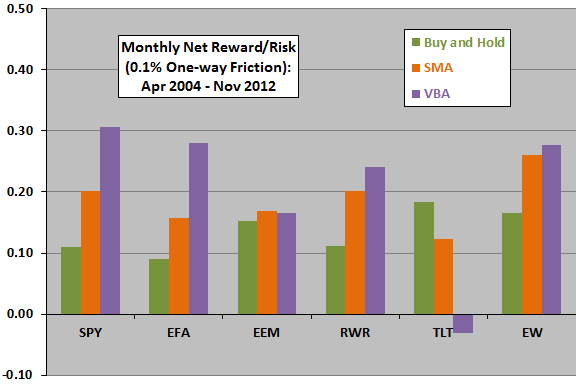
The following chart summarizes simple monthly net reward-to-risk ratios (average return divided by standard deviation of returns) over the available sample period for each ETF and for the equally weighted combination of ETFs (EW) based on:
- No timing (Buy and Hold).
- Timing only with the ETF SMAs (SMA).
- Timing as specified by VBA (VBA).
Results show that VBA improves net reward-to-risk ratios for three of five ETFs and for the equally weighted portfolio (by suppressing volatilities, not improving returns), but clearly does not work for TLT. Based on monthly net Sharpe ratios instead of reward-to-risk ratios for the EW portfolios, SMA (0.21) slightly outperforms VBA (0.20) and both beat Buy and Hold (0.13).
Reversing the VIX SMA signal for TLT (under the assumption that equity market volatility drives investors to government bonds) greatly improves the TLT allocation performance (beating the buy and hold alternative). This logic may also apply to gold if included in the asset class mix.
For comparison, the monthly net reward-to-risk ratio for the Asset Class Momentum Strategy over the same period (holding the asset class proxy with the highest return over the past five months, with 0.2% switching friction) is 0.22.
How do these results translate to cumulative returns?

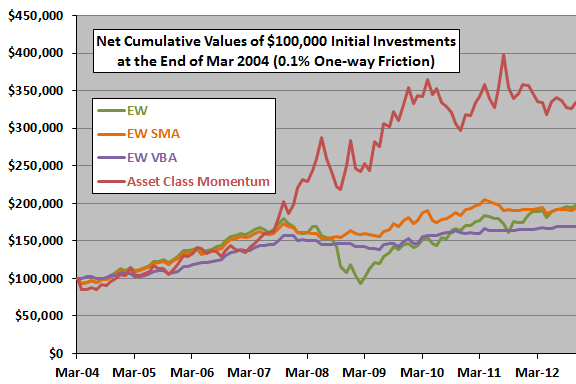
The next chart compares net cumulative values of $100,000 initial investments at the end of March 2004 in three alternatives:
- An equally weighted, monthly rebalanced portfolio of the five ETFs (EW).
- An equally weighted, monthly rebalanced portfolio of the five ETFs timed via by respective ETF SMAs (EW SMA).
- An equally weighted, monthly rebalanced portfolio of the five ETFs timed via VBA (EW VBA).
- The Asset Class Momentum Strategy (holding the asset class proxy with the highest return over the past five months, with 0.2% switching friction).
All alternatives perform similarly until early 2008, when the Asset Class Momentum Strategy (despite a very bad start) begins to excel. Despite a bad start, both EW and EW SMA have higher terminal values than EW VBA, and EW SMA seldom lags EW VBA.
Reversing the VIX SMA signal for TLT (as noted above), improves the cumulative return for EW VBA such that its terminal value is about the same as EW and EW SMA, but with much lower volatility.
How sensitive are results to the assumed level of trading friction?

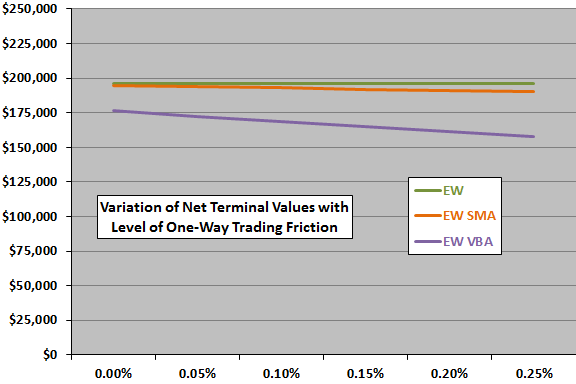
The final chart compares terminal values for EW, EW SMA and EW VBA as defined above for different levels of trading friction applied to switches between ETFs and T-bills (each switch affecting one fifth of the portfolio). EW has no such switches, EW SMA generates 44 total switches, and EW VBA generates 226 switches. EW VBA is therefore comparatively sensitive to the level of trading friction.

In summary, evidence from simple tests of VBA using recent ETF data is mixed, preferable only to investors with strong aversion to portfolio volatility.
In other words, the strategy may overly lean toward the risk-free rate.
Cautions regarding findings include:
- As noted, calculations involve slight anticipation of monthly SMAs.
- As noted, the analysis ignores the trading frictions associated with monthly rebalancing of portfolios to equal weights. This friction may be material for some investors (but would be similar across alternative strategies).
- Some investors may not be able to achieve 0.1% trading friction.
- There may be data snooping bias in the specified SMA measurement intervals, such that future strategy performance would be lower.