
What are the principal strategies for exploiting the volatility and volatility skew risk premiums? In his May 2016 workshop presentation package entitled “Volatility Modelling and Trading”, Artur Sepp provides an overview of systematic volatility risk premium capture strategies. He focuses on simple rule-based strategies with monthly reformation suitable for an investable index or a proprietary strategy. He covers delta-hedged strategies for capturing the volatility/volatility skew risk premiums (straddles/strangles) and buy-write and put-write options strategies as applied to major stock indexes and liquid exchange-traded funds (ETF). He covers the following strategy elements:
- Measuring realized volatility.
- Forecasting expected volatility.
- Measuring and forecasting implied and realized volatility skew.
- Computing option delta.
- Trading off transaction costs versus delta risk.
- Managing tail risk.
Using relevant data for target assets during January 2005 through January 2016, he finds that:
- Over the selected sample period, a straddle strategy that each month sells one-month at-the-money puts and calls on SPDR S&P 500 (SPY) options and holds to expiration with daily delta hedge adjustments (subject to 0.03% trading frictions) generates annualized return 7.43%, annualized volatility 8.0%, annualized Sharpe ratio 0.88 and maximum drawdown -19%. Comparable performance data for the S&P 500 Index are annualized return 6.58%, annualized volatility 18.0%, annualized Sharpe ratio 0.36 and maximum drawdown -52%.
- Over the selected sample period, a strangle strategy that each month sells one-month out-of-the-money puts and calls on SPY options and holds to expiration with daily delta hedge adjustments (subject to 0.03% trading frictions) generates annualized return 8.55%, annualized volatility 7.0%, annualized Sharpe ratio 1.21 and maximum drawdown -19%.
- There is a trade-off between hedging precision (rebalancing frequency) and trading frictions required to adjust hedges.
- In general, simple volatility premium harvesting strategies capture much or all of equity market performance with lower volatilities and less severe maximum drawdowns (see the charts below).
The following charts, taken from the presentation, compare cumulative total performances (upper chart) and cumulative drawdowns (lower chart) for four simple strategies over the sample period:
- Buy and hold SPY (S&P 500).
- Rolling SPY straddles as specified above covered by cash (Naked Straddle).
- Rolling SPY strangles as specified above covered by cash (Naked Strangle).
- Rolling covered calls (Covered Call).
Results show that the option strategies capture much or all of equity market performance with lower volatilities and less severe maximum drawdowns.
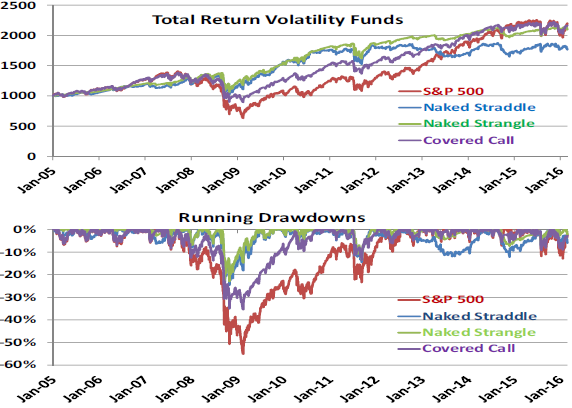
In summary, evidence from a recent 11-year sample indicates that systematic short option strategies designed to capture the volatility and volatility skew risk premiums capture much or all of the underlying equity premium with relatively low volatilities and shallow maximum drawdowns.
Cautions regarding findings include:
- The sample period is short for analysis of annualized performance. Moreover, the sample includes the very unusual market crash and rebound of 2008-2009, but the presentation does not test robustness to exclusion of this event.
- The transaction costs assumed for establishing and maintaining delta hedges (0.03% of trade value) may be unachievable by some investors.
- At times, the presentation format is vague. It appears that performance calculations do not include trading frictions for opening and, when necessary, closing short option positions. Calculations do not include any fees for investors delegating strategy execution to an investment manager/fund.
- ETFs that implement the CBOE S&P 500 call-write and put-write indexes fall short of the hypothetical performances of those indexes (see “Simple Stock Index Option Strategies”).
See also:
- “Performance of CBOE PutWrite Indexes”
- “Enhancement of Index Covered Calls via Hedging”
- “Stress Test for Equity Index Option Strategies”
- “Option Straddles Around Earnings Announcements”
- The live “Strategy Test” of selling equity index put options.
Frequently Asked Questions
What is a short volatility strategy that sells straddles or strangles?
A short volatility strategy that sells straddles or strangles collects option premiums by selling both puts and calls on an asset, such as SPY, to capture the volatility and volatility skew risk premiums. A straddle sells at-the-money options, while a strangle sells out-of-the-money options. In the article's tests, positions are reformed monthly, held to expiration, and adjusted with daily delta hedging.
Do short straddle and strangle strategies outperform buying and holding the S&P 500?
Short straddle and strangle strategies on SPY options outperformed buy-and-hold in the January 2005 to January 2016 sample, with much lower volatility and shallower drawdowns. Straddles returned 7.43% annually versus 6.58% for the S&P 500, with 8.0% versus 18.0% volatility and a -19% versus -52% maximum drawdown. Strangles returned 8.55% with 7.0% volatility and a Sharpe ratio of 1.21. This comes from a short 11-year sample.
How does a delta-hedged short straddle strategy on SPY options work?
The delta-hedged short straddle strategy on SPY options sells one-month at-the-money puts and calls each month and holds them to expiration. The position's delta is adjusted daily, with 0.03% trading frictions assumed on the hedges. The strategy requires trading off hedging precision (rebalancing frequency) against the transaction costs of adjusting hedges.
How do short straddles and strangles compare with covered call strategies and holding the S&P 500?
Short straddles and strangles on SPY, rolling covered calls, and buy-and-hold SPY were compared over January 2005 to January 2016. The option strategies captured much or all of the equity market's performance with lower volatility and less severe maximum drawdowns. Strangles had the highest Sharpe ratio reported (1.21), versus 0.88 for straddles and 0.36 for the S&P 500.
What are the limitations and risks of backtested short volatility option strategies?
The backtested short volatility strategies rest on a sample too short for reliable annualized performance estimates, and the sample includes the 2008-2009 crash and rebound without testing robustness to excluding it. The assumed 0.03% hedging cost may be unachievable for some investors, and the calculations appear to omit trading frictions for opening and closing the short options and any manager or fund fees. ETFs implementing CBOE call-write and put-write indexes also fall short of those indexes' hypothetical performance.