Do upside (downside) market volatility surprises scare investors out of (draw investors into) the stock market? In the November 2013 version of his paper entitled “Dynamic Asset Allocation Strategies Based on Unexpected Volatility”, Valeriy Zakamulin investigates the ability of unexpected stock market volatility to predict future market returns. He calculates stock market index volatility for a month using daily returns. He then regresses monthly volatility versus next-month volatility to predict next-month volatility. Unexpected volatility is the series of differences between predicted and actual monthly volatility. He tests the ability of unexpected volatility to predict stock market returns via regression tests and two market timing strategies. One strategy dynamically weights positions in a stock index and cash (the risk-free asset) depending on the prior-month difference between actual and past average unexpected index volatility. The other strategy holds a 100% stock index (cash) position when the prior-month difference between actual and average past unexpected index volatility is negative (positive). His initial volatility prediction uses the first 240 months of data, and subsequent predictions use inception-to-date data. He ignores trading frictions involved in strategy implementation. Using daily and monthly (approximated) total returns of the S&P 500 Index and the Dow Jones Industrial Average (DJIA), along with the U.S. Treasury bill (T-bill) yield as the return on cash, during January 1950 through December 2012, he finds that:
- Over the entire sample period, unexpected S&P 500 Index (DJIA) volatility relates negatively to future index returns, with an R-squared statistic of 0.02 (0.01). In other words, monthly variation in unexpected volatility explains 1-2% of the variation in next-month index return. However, the relationship flips to positive during the 1990s.
- Applied to the S&P 500 Index, the following three strategies generate annualized gross Sharpe ratios of 0.57, 0.43 and 0.36, respectively:
- Each month weight stocks according to the prior-month difference between actual and average past unexpected volatility divided by the standard deviation of past unexpected volatility (calibrated to 50% when the difference is zero).
- A similar strategy based on total rather than unexpected volatility.
- A benchmark strategy consisting of 50% index-50% cash, rebalanced monthly.
- Applied to the S&P 500 Index, the following three strategies generate annualized gross Sharpe ratios of 0.54, 0.47 and 0.36, respectively (see the chart below):
- Each month, hold the index (cash) if the prior-month difference between actual and average past unexpected volatility is negative (positive).
- Each month, hold the index (cash) if the index is above (below) its SMA10 at the end last month.
- A benchmark strategy consisting of 75% index-25% cash, rebalanced monthly, specified to approximate the volatility of the SMA10 strategy. [This is a separate clarification from the author.]
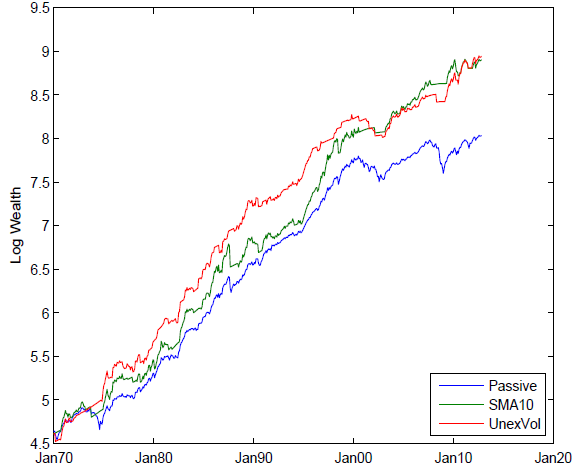
The following chart, taken from the paper, tracks gross cumulative values of $100 initial investments at the end of 1969 in each of the second set of three strategies above. Specifically, the competing strategies are:
- Passive: 75% stock index-25% cash, rebalanced monthly.
- SMA10: each month, hold the S&P 500 Index (cash) if it is above (below) its SMA10 at the end of last month.
- UnexVol: each month, hold the S&P 500 Index (cash) if the prior-month difference between actual and average past unexpected volatility is negative (positive).
The two timing strategies beat buy-and-hold based on both gross terminal value and gross risk-adjusted monthly and annual performance. While the two timing strategies have similar gross terminal values, the one based on unexpected volatility generates the steadier monthly and annual performance.
In summary, evidence suggests that unexpected stock market volatility may usefully predict market performance at a monthly horizon.
Cautions regarding findings include:
- All performance metrics are gross, not net. Including trading frictions, which are high during part of the sample period, would lower reported returns.
- The passive benchmarks in the study are arguably unrealistic, since an investor using them would incur monthly trading frictions for rebalancing. A fixed 100% index allocation is more realistic.
- Moreover, it seems likely that the strategies based on unexpected volatility trade more frequently than that based on SMA10, such that gross outperformance may not mean net outperformance. [The author separately reports that the SMA10 (unexpected volatility) strategy applied to the S&P 500 Index generates 58 (145) trades during 1970-2012. Compounded friction is therefore substantial, and substantially lower for SMA10 than for unexpected volatility.]
- The study uses indexes rather than tradable assets, thereby ignoring any costs of creating and maintaining tracking funds.
- The methodology assumes zero delay between signal generation and execution, which may be problematic for the relatively complex calculations that determine allocations based on unexpected volatility.