Can investors beat the market by avoiding high volatility and embracing low volatility? In the April 2016 version of their paper entitled “Volatility Managed Portfolios”, Alan Moreira and Tyler Muir test the performance of a simple volatility timing approach that lowers (raises) exposure to risky assets when volatility of recent returns for those assets is relatively high (low). Contrary to conventional wisdom, this volatility-managed strategy sells during panics like the Great Depression and 2008. Specifically, they construct portfolios that scale exposure to a stock factor portfolio or a currency carry trade by the inverse of expected variance. They consider widely used stock factor portfolios such as market, size, book-to-market, momentum, investment and profitability. They also consider a high-yield minus low-yield currency carry trade. They distinguish between a short-term trader, who responds the same way to all changes in volatility, and a long-term investor, who does not care about losses that predictably reverse (discount rate shocks) but does care about persistent losses (cash flow shocks). Their principal strategy scales risky holdings by the inverse of realized daily return variance over the past month, scaled up or down to have the same standard deviation as buy-and-hold. To estimate net performance, they consider trading frictions of 0.01%, 0.10% and 0.14%. Using daily and monthly factor portfolio returns from Kenneth French during 1926 or 1963 through 2015 and currency carry trade returns during 1983 through 2015, they find that:
- A volatility-managed strategy applied to factor portfolios produces large gross alphas and boosts gross Sharpe ratios by 50% to 100% over buy-and-hold. For example:
- Timing the market factor produces gross annualized alpha 4.86% with beta only 0.6.
- Timing the momentum factor produces the highest gross annualized alpha (12.5%).
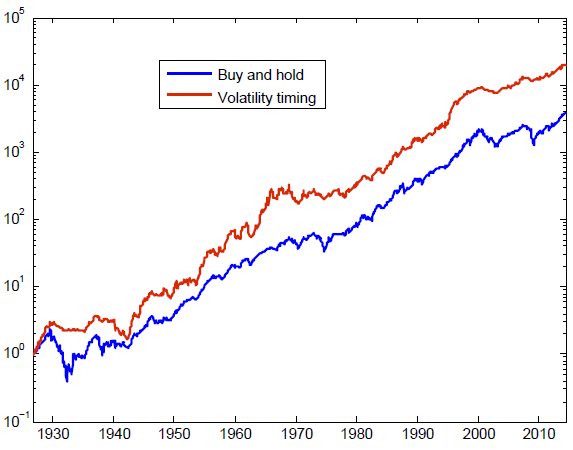
- While not always outperforming buy-and-hold, the strategy produces fairly steady gains (for example, see chart below).
- The strategy generally performs well during NBER economic contractions and crises. For example, the volatility-managed market factor portfolio has beta 0.83 (-0.51) during economic expansions (contractions).
- The strategy works well on a net basis using the low estimates of trading frictions specified above. Breakeven trading frictions range from 0.56% and 0.84% for simple volatility weightings to 1.83% for a complex approach.
- Across 20 developed countries, volatility-managed stock market indexes average 0.15 higher gross annualized Sharpe ratio than buy-and-hold. Sharpe ratios are higher for 80% of markets.
- A combination of buy-and-hold portfolio and volatility-managed portfolio approximates the mean-variance optimal portfolio.
- Short-term investors put 100% weight on the volatility-managed portfolio.
- Long-term investors apply higher (lower) weight to the volatility-managed portfolio when changes in volatility come from persistent cash flow shocks (mean-reverting discount rate shocks).
- Forecasting variance with regressions based on three lags of the logarithm of realized variance instead of simple past realized variance generally increases volatility-managed alphas, but is less practical.
The following chart, taken from the paper, compares on a logarithmic scale gross cumulative values of $1 initial investments in the U.S. stock market factor with (Volatility timing) and without (Buy and hold) simple volatility management during 1926 through 2015. The volatility timing strategy is scaled to have the same standard deviation as buy-and-hold, sometimes requiring leverage. Results indicate that volatility timing mostly outperforms buy-and-hold on a gross basis.
In summary, evidence indicates that weighting investments in risky asset portfolios by inverse volatility may enhance gross risk-adjusted performance.
Cautions regarding findings include:
- Trading friction estimates are much too low for large parts of the sample period (see “Trading Frictions Over the Long Run”). Profitability may not survive trading frictions during these parts.
- Most of the strategy variations considered include leverage when asset return volatility is very low, but ignore the cost of leverage (whether via borrowing or index options). Accounting for cost of leverage would lower strategy performance.
- Testing multiple model variations across the same or similar sets of data impounds snooping bias, such that the best-performing model overstates expectations.
- Factor portfolios are essentially indexes. Creating liquid funds from these indexes would involve costs and fees (especially momentum). Moreover, most factor portfolio returns are long-short and would involve shorting costs and shorting feasibility issues. Accounting for all these costs would reduce performance.