
Do broker stock recommendations predict future returns? Are analysts at independent brokers more accurate than those associated with investment banking firms? Did the changes in research rules after the Internet bubble affect analyst behavior? In his November 2006 paper entitled “Do Affiliated Analysts Mean What They Say?”, Michael Cliff compares the performance of stock recommendations made by analysts employed by lead underwriters to that of recommendations made by analysts working at independent brokers. Using data for the period 1994-2005 (13,794 recommendations from lead underwriters and 10,216 from independent brokers), he finds that:
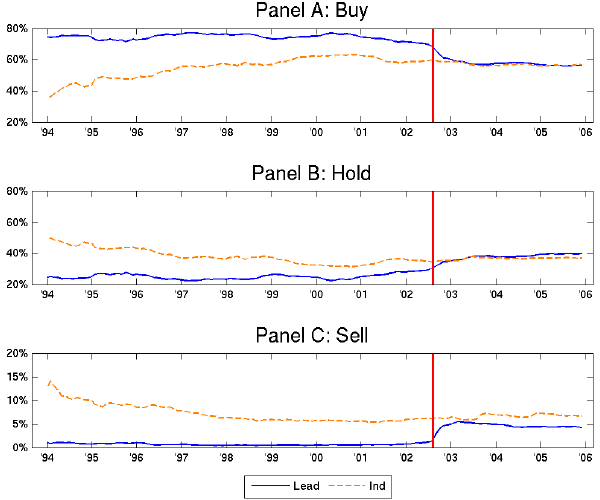
- The median recommendation life is six to nine months. Since the conflict-of-interest rule changes of NASD rule 2711, the distribution of recommendations from both lead underwriters and independent brokers is about 55% buy, 40% hold and 5% sell. Over 90% of coverage initiations by lead underwriters are buy, compared to 75% for independents brokers.
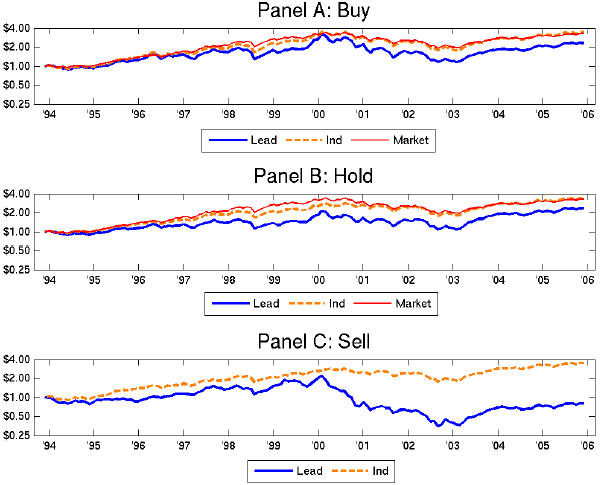
- Buy and hold recommendations from lead underwriters underperform both the market and the buy and hold recommendations from independent brokers by about 0.25% per month (risk-adjusted).
- Sell recommendations from lead underwriters underperform both the market and the sell recommendations from independent brokers by about 0.70% per month (risk-adjusted).
- Over a three-day announcement period:
- Buy recommendations of lead underwriters (independent brokers) produce an abnormal return of +1.2% (+0.6%). These returns are larger since NASD rule 2711.
- Hold recommendations of lead underwriters (independent brokers) produce an abnormal return of -7.1% (-1.4%). These returns are less negative since NASD rule 2711.
- Sell recommendations of lead underwriters (independent brokers) produce an abnormal return of -6.2% (-2.1%).
The following set of charts, taken from the paper, shows the distribution of recommendations from lead underwriters (Lead) and from independent brokers (Ind). The solid vertical line marks implementation of most of the requirements of NASD rule 2711, designed to eliminate conflicts of interest for lead underwriters. The charts show that, prior to the rule changes, lead underwriters presented a much more positive distribution than did independent brokers.
The next set of charts, also from the paper, compares the values over time of a $1 initial investment in the buy, hold and sell recommendations from lead underwriters (Lead) and from independent brokers (Ind). The portfolios are formed based on recommendations between 1994 and 2005, rebalanced daily to reflect recommendation changes. The thin line indicates the value of a benchmark value-weighted market portfolio. The charts show that lead underwriter (independent broker) buy and hold recommendations underperform (match) overall market performance. Lead underwriter (independent broker) sell recommendations dramatically underperform (match the performance of) their buy and hold recommendations.
In summary, lead underwriter sell recommendations may be the only analyst calls worth tracking.
Frequently Asked Questions
What is a lead underwriter analyst recommendation in stock research?
A lead underwriter analyst recommendation is a buy, hold or sell rating issued by an analyst employed at the investment bank that led a company's securities offering. These analysts face potential conflicts of interest because their firm earns underwriting fees from the companies they cover. In the 1994-2005 study, such recommendations (13,794 in total) were compared with those from independent brokers (10,216).
Do lead underwriter sell recommendations predict stock underperformance?
Lead underwriter sell recommendations did predict underperformance, trailing both the market and independent broker sell recommendations by about 0.70% per month (risk-adjusted) over 1994-2005. Their sell calls also dramatically underperformed their own buy and hold calls, while independent broker sells merely matched them. The study concludes lead underwriter sells may be the only analyst calls worth tracking.
How is the performance of broker stock recommendations measured and compared?
Performance was measured by forming portfolios of buy, hold and sell recommendations from 1994 to 2005, rebalanced daily to reflect recommendation changes, and comparing risk-adjusted monthly returns to a value-weighted market benchmark. Recommendations from lead underwriters were compared with those from independent brokers. Abnormal returns were also measured over a three-day announcement window around each recommendation.
How do independent broker recommendations compare to investment bank analyst recommendations?
Independent broker recommendations were more balanced and more accurate than lead underwriter recommendations. Over 90% of lead underwriter coverage initiations were buys versus 75% for independent brokers, and lead underwriter buy and hold calls underperformed independent ones by about 0.25% per month (risk-adjusted). Independent broker buy and hold calls roughly matched the market, while lead underwriter buy and hold calls underperformed it.
Has the NASD rule 2711 eliminated analyst conflicts of interest, and what are the limits of these findings?
The findings suggest NASD rule 2711 changed analyst behavior but did not clearly eliminate differences between lead underwriters and independent brokers. After the rule, both groups' ratings converged to about 55% buy, 40% hold and 5% sell, and lead underwriter buy announcement returns grew larger while hold returns became less negative. The results cover only 1994-2005 and risk-adjusted performance depends on the benchmark used, so they may not apply to other periods.