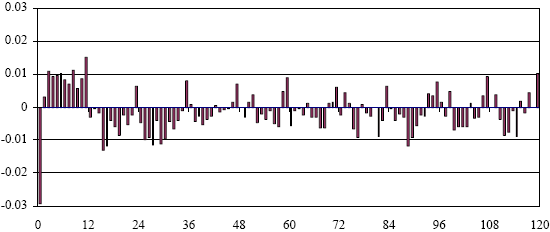
Stocks that beat the local market in a given month tended to do so in the same calendar month in later years; a long/short strategy on 12-month-lagged returns earned 0.52% per month in years two to ten (Canada, Japan, 12 European countries; Jan 1985–Jun 2006; monthly rebalanced deciles).
Do stocks have annual rhythms beyond the January effect? In their March 2007 paper entitled “Common Patterns of Predictability in the Cross-Section of International Stock Returns”, Steven Heston and Ronnie Sadka investigate cyclic patterns of return predictability for stocks in Canada, Japan and twelve European countries (chosen based on the number of firms available for analysis). Using monthly returns over the period January 1985 through June 2006 (258 months), they conclude that:
Stocks that outperform the local market in a given month tend to outperform in the same calendar month for many years, while underperforming in most other months. Zero-cost portfolios that are long/short the tenths of stocks with highest/lowest past monthly returns 12 months ago, rebalanced monthly, earn an average of 0.52% per month in years two through ten. By contrast, a similar strategy using past returns across an entire year earns -1.3% per month over the same period.
While results are most pronounced for a January cycle, the 12-month return effect holds for most calendar months.
This pattern is independent of firm size, stock beta, currency and country effects.
The following chart, taken from the paper, shows how average stock returns for a given month relate to stock returns for past months 1-120 (ten years). Except for the most recent month, the relationships are positive for all lags up to one year, indicating an international momentum effect. Beyond one year back, there is a reasonably consistent pattern of positive relationships at 12-month intervals with return reversals in between.
In summary, there is a tendency for stocks worldwide to reprise their monthly return behavior every 12 months, with intracycle reversals, over periods of many years. Results suggest calendar-connected market structures.
Asset Class ETF Seasonalities? PremiumAverage monthly returns for nine asset class ETFs (SPY, IWM, EFA, EEM, TLT, LQD, VNQ, GLD, DBC) are mostly positive in April, July, November…
Style Performance by Calendar Month PremiumStyle ETFs show modest monthly return differences versus SPY, with value outperforming growth in Mar/Apr/Dec and growth leading in Oct/Nov (Aug 2001–Oct 2021; 20-year…
Sector Performance by Calendar Month PremiumAverage returns and return dispersion across nine Select Sector SPDR ETFs (XLB, XLE, XLF, XLI, XLK, XLP, XLU, XLV, XLY) differ somewhat by calendar…
“Sell in May” Over the Long Run Premium"Sell in May" stocks underperformed November-April stocks (CAGR not specified vs buy-and-hold benchmark; Apr 1871–Apr 2021; seasonal timing with 1% trading costs; S&P Composite…
Stock Market Continuation and Reversal Months? PremiumCalendar-month correlations between S&P 500 and Russell 2000 monthly returns and prior 3-, 6- and 12-month returns show unstable continuation/reversal patterns across subperiods and…