
Does the S&P 500 implied volatility index (VIX) exhibit systematic behaviors by day of the week, around turn-of-the-month (TOTM) or around options expiration (OE)? If so, are the behaviors exploitable? Using daily closing levels of VIX since January 1990, daily opening levels of VIX since January 1992 and daily reverse split-adjusted opening and closing levels of iPath S&P 500 VIX Short-Term Futures ETN (VXX) since February 2009, all through early July 2015, we find that:
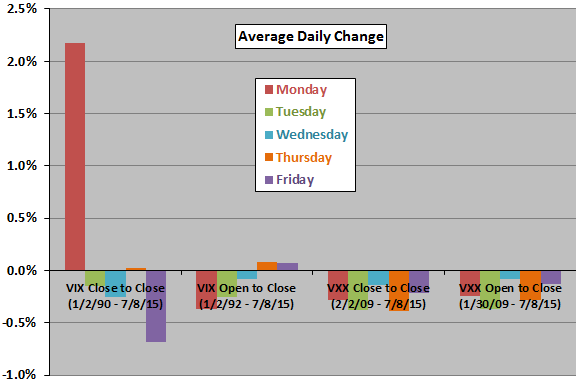
The following chart summarizes average close-to-close and open-to-close changes in VIX and VXX by day of the week over available sample periods. The most prominent anomaly is the large close-to-close average increase in VIX for Monday (from the close the prior week to the close on Monday). The overall impression is that VIX tends to fall during the week and pop back up over the weekend. However, the VXX sample (incorporating expectations of VIX futures traders) indicates that the weekend pop in VIX is not exploitable via short-term VIX futures.
What about day of the week volatility of volatility?
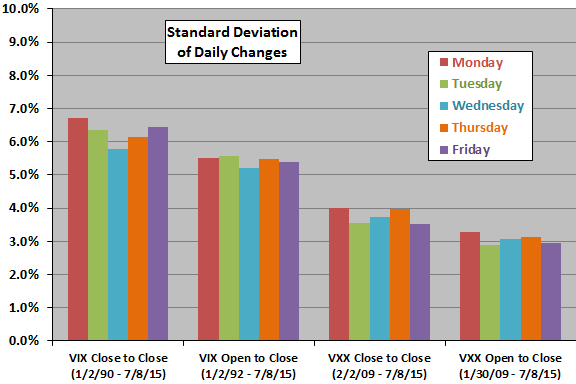
The next chart summarizes standard deviations of close-to-close and open-to-close changes in VIX and VXX by day of the week over available sample periods. Volatility of volatility does not vary much with day of the week.
VXX tends to be calmer than VIX. A test of VIX volatility since February 2009 (not shown) confirms that VXX is calmer than VIX over the subperiod since VXX inception.
What about VIX and VXX behaviors around TOTM?
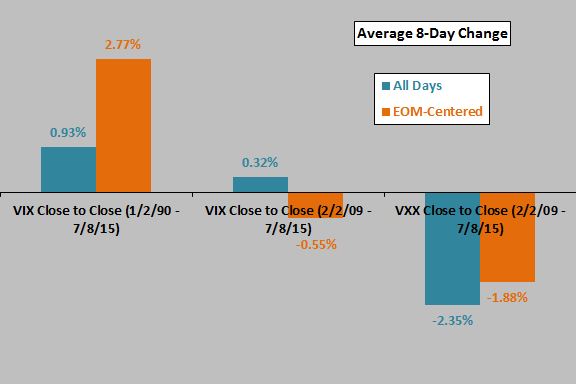
The next chart compares average close-to-close changes in VIX and VXX over all intervals of eight trading days and over intervals of eight trading days centered on the ends of the month (EOM). There are 306 EOM-centered observations for VIX and 76 for VXX. Since the TOTM interval has a relatively strong average S&P 500 Index return, one might expect an average decline in volatility. However, over the entire sample period, VIX tends to rise more during TOTM than during eight-day intervals in general. During the recent subperiod since VXX inception, VIX and VXX changes during TOTM are not notably different from those during eight-day intervals in general.
What about OE days?
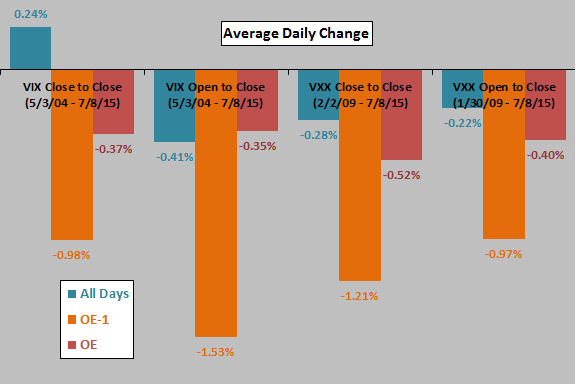
The first chart below compares average close-to-close and open-to-close changes in VIX and VXX for all days, for the day before VIX options expiration (OE-1) and for VIX options OE days since the introduction of VIX options in May 2004. OE-1 is the last day for trading before expiration. There are 130 OE observations for VIX and 77 for VXX.
Results indicate that changes in VIX and VXX are abnormally negative for OE-1. For VXX close-to-close (open-to-close), 56 (57) of 77 OE-1 returns are negative; however, there are 4 (2) positive returns of at least 5%. The second chart below shows the time series of OE-1 close-to-close returns for VXX since its inception.
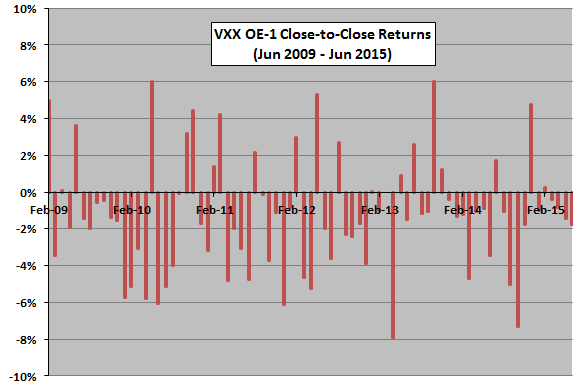
In summary, evidence from simple tests of available data suggest that one VIX short-term calendar anomaly, an average large drop on OE-1, is also an anomaly for VXX.
Cautions regarding findings include:
- The VXX sample is not large for monthly events (TOTM and OE). The VXX sample is very small in terms of number of VIX regimes.
- VXX return calculations are gross. Trading frictions diminish any exploitability.
- Testing many rules on the same data introduces snooping bias, such that the best-performing rule overstates expectations.
See also “VIX Day-of-the-Week Effects”, “VIX Behavior Around Holidays” and the statistically more tenuous “VIX-VXX Seasonality”.
Frequently Asked Questions
What are VIX calendar effects and how do they relate to the VIX index?
VIX calendar effects are systematic patterns in the S&P 500 implied volatility index (VIX) tied to the day of the week, turn-of-the-month (TOTM) or options expiration (OE). The article examines whether VIX behaves abnormally around these points and whether any pattern is exploitable. It uses daily VIX data since January 1990 and VXX (iPath S&P 500 VIX Short-Term Futures ETN) data since February 2009, all through early July 2015.
Does the VIX fall before options expiration, and can traders profit from it?
The VIX does tend to fall abnormally on the day before VIX options expiration (OE-1), and the same drop appears in VXX. For VXX close-to-close, 56 of 77 OE-1 returns were negative (57 of 77 open-to-close), though there were 4 (2) positive returns of at least 5%. The article cautions that returns are gross of trading frictions, so exploitability is limited.
How do you test for day-of-the-week effects in VIX and VXX?
Day-of-the-week effects in VIX and VXX are tested by comparing average close-to-close and open-to-close changes, plus standard deviations of those changes, across weekdays. The VIX samples use daily closes since January 1990 and opens since January 1992, and the VXX sample uses reverse split-adjusted opens and closes since February 2009, all through early July 2015. The most prominent finding is a large average Monday close-to-close increase in VIX, while volatility of volatility varies little by weekday.
Is the Monday VIX jump the same as a profitable VXX trade?
No, the Monday pop in VIX is not the same as an exploitable VXX trade. VIX tends to fall during the week and rise over the weekend, but the VXX sample, which reflects the expectations of VIX futures traders, indicates the weekend pop is not exploitable via short-term VIX futures. VXX also tends to be calmer than VIX over the period since its February 2009 inception.
What are the limitations of VIX calendar anomaly findings?
The VIX calendar anomaly findings are limited by small VXX samples for monthly events (77 OE observations and 76 turn-of-the-month observations) and by very few VIX regimes in the VXX period. VXX return calculations are gross, so trading frictions reduce any exploitability. Testing many rules on the same data also introduces snooping bias, which means the best-performing rule overstates expected results.