
The conclusion of “10-Month SMA Timing Signals Over the Long Run” is that 10-month simple moving average (SMA) timing signals (with current price above/below its 10-month SMA viewed as bullish/bearish) are mostly beneficial over the long run. However, this study involves complex modeling assumptions that limit confidence in its conclusion. How well do 10-month SMA crossing signals work for an investable proxy of the U.S. stock market over a recent sample period? To check, we test several variations of a 10-month SMA timing strategy on S&P Depository Receipts (SPY) since the introduction of this exchange-traded fund. Using daily and monthly closes for SPY, both unadjusted and adjusted for dividends, from inception in January 1993 through September 2010 and contemporaneous 3-month Treasury bill (T-bill) yields, we find that:
We consider four variations of a 10-month SMA timing strategy, with signals derived from:
- Monthly dividend-adjusted closing levels of SPY.
- Monthly unadjusted closing levels of SPY.
- Monthly values of SPY calculated as the average daily dividend-adjusted closing levels during the month.
- Monthly values of SPY calculated as the average daily unadjusted closing levels during the month.
The latter two approaches suppress the effects of the turn of the month and other aspects of intra-month volatility on the SMA signals.
Modeling assumptions are as follows:
- Funds move to SPY (cash) when the SPY measurement crosses above (below) its 10-month SMA as of the end of each month.
- Trades are coincident with the signal at the month-end dividend-adjusted level of SPY (requiring that signal calculation occur accurately just before the close on the last day of the month).
- Cash earns interest monthly at one twelfth the contemporaneous T-bill annualized yield.
- One-way trading friction for moving in and out of SPY is 0.2% over the entire sample period.
- Ignore the tax implications of trading.
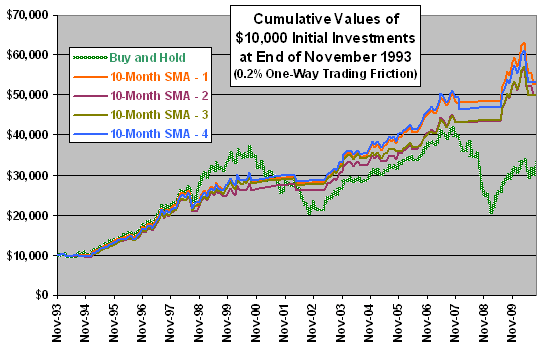
The following chart plots the cumulative values of $10,000 initial investments a SPY buy-and-hold strategy and in each of the four 10-month SMA timing strategies defined above (numbered in the above sequence). The 1-month SMA timing strategies are in stocks about 70% of the time. All four 10-month SMA timing strategies have substantially higher terminal values than buy-and-hold. While the first and last SMA strategies beat the second and third, the margins of outperformance are modest, and there is little reason to believe that any one of the strategies is reliably superior (especially since the first and last ways of calculating SPY level are so different).
Buy-and-hold beats 10-month SMA timing until about 2001 and then falls behind for the balance of the sample period. Note that during the 2000s, per “The 2000s: A Market Timer’s Decade?“, even random monthly timing strongly tends to beat buy-and-hold.
Results are fairly insensitive to the assumed level of trading friction.
For additional insight, we look at some monthly return metrics.
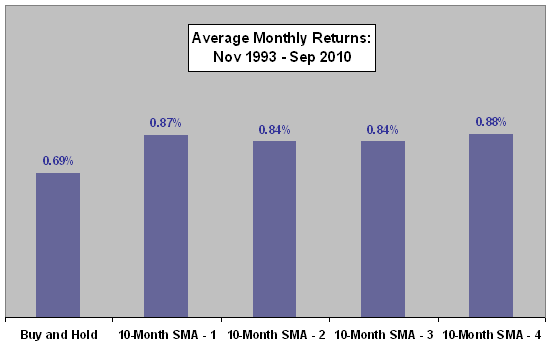
The next chart compares average monthly returns over the entire sampler period for a buy-and-hold strategy and the four 10-month SMA timing strategies. The similar results for the four SMA strategies all beat buy-and-hold.
What about realized volatilities of returns?
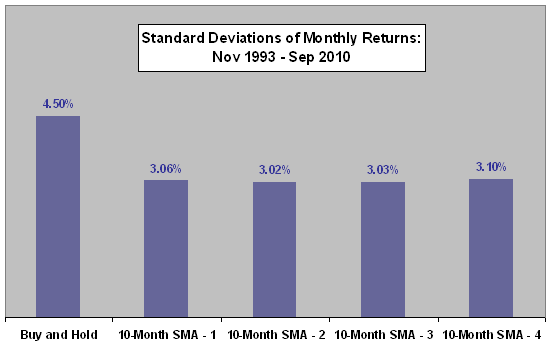
The next chart compares standard deviations of monthly returns over the entire sampler period for the same strategies. The four SMA strategies are all comparably less volatile than buy-and-hold.
What about return per unit of risk (realized volatility)?
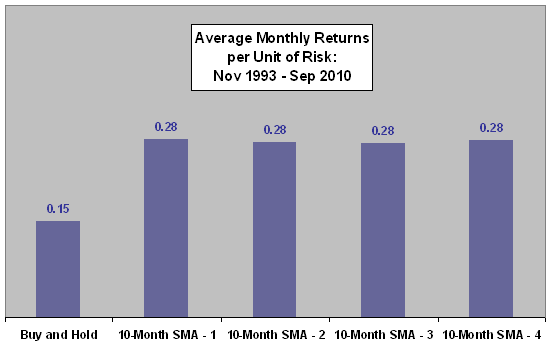
The final chart compares the ratios of average monthly return to standard deviation of monthly returns over the entire sampler period for the same strategies. The four SMA strategies are all almost identically more attractive than buy-and-hold.
Results for the four 10-month SMA timing strategies indicate no material sensitivity to the method of generating 10-month SMA signals.
In summary, evidence from simple tests indicate that 10-month SMA timing strategies, implemented in any of several reasonably realistic variations, effectively mitigate the bull-bear volatility experienced over the past decade.
The forward experience of investors using such SMA timing strategy will depend on the severity of bull-bear volatility in future years.
Frequently Asked Questions
What is a 10-month simple moving average (SMA) timing signal?
A 10-month simple moving average (SMA) timing signal treats the market as bullish when its current price is above its 10-month SMA and bearish when it is below. In the tested strategy, funds move into SPY (the S&P 500 ETF) on a bullish crossing and into cash on a bearish crossing, evaluated at each month-end.
Does a 10-month SMA timing strategy beat buy-and-hold for the S&P 500?
A 10-month SMA timing strategy beat SPY buy-and-hold from January 1993 through September 2010, with all four tested variants showing substantially higher terminal values, higher average monthly returns, lower volatility, and better return per unit of risk. Buy-and-hold led until about 2001, and the timing strategies pulled ahead for the rest of the sample. Results were fairly insensitive to the assumed trading friction.
How is a 10-month SMA timing strategy tested on SPY?
The 10-month SMA timing strategy was tested on SPY using monthly signals from January 1993 through September 2010, moving into SPY when the measure crossed above its 10-month SMA and into cash when it crossed below. Cash earned one twelfth of the annualized 3-month T-bill yield each month, one-way trading friction was 0.2%, and taxes were ignored. Four variants used month-end or average-of-daily SPY levels, each either dividend-adjusted or unadjusted.
Does it matter whether SMA signals use month-end prices or monthly average prices, or dividend-adjusted versus unadjusted data?
The method of calculating the SPY level for 10-month SMA signals made no material difference to results. Month-end versus average-of-daily levels, and dividend-adjusted versus unadjusted data, all produced similar outperformance versus buy-and-hold. The first and last variants slightly beat the other two, but there is little reason to believe any one is reliably superior.
What are the limitations of 10-month SMA timing strategy results?
The 10-month SMA timing results come from a short sample (January 1993 to September 2010) dominated by the bull-bear volatility of the 2000s, a period when even random monthly timing tended to beat buy-and-hold. Future results will depend on the severity of bull-bear volatility in coming years. The tests also assume trades at month-end prices, require accurate signal calculation just before the close, and ignore taxes.