Current price versus 10-month simple moving average (SMA) is a widely used indicator of asset and asset class trend, with current price above/below its 10-month SMA viewed as bullish/bearish. How has this indicator performed for U.S. equities in aggregate over the long run? To investigate, we employ the long-run data set of Robert Shiller to construct a very long backtest of 10-month SMA crossing signals. This data set includes monthly levels of the S&P Composite Index, calculated as average of daily closes during the month. This method of calculation deviates from that most often used for SMA signals, but arguably suppresses the effects of the turn of the month and any other monthly patterns on SMA signals. Using S&P Composite Index levels, associated dividend yields and contemporaneous long-term interest rates (comparable to yields on 10-year Treasury notes) from the Shiller data set spanning January 1871 through December 2012 (1,704 months or about 142 years), we find that:
Modeling assumptions for this backtest are complex, as follows:
- Funds move to stocks (cash) when the S&P Composite Index crosses above (below) its 10-month SMA as calculated monthly.
- Trades are coincident with the signal at the monthly level of the S&P Composite Index. Since the monthly level is the average daily close for the month, this assumption may be optimistic or pessimistic.
- Cash earns a monthly baseline risk-free yield estimated as one twelfth the long-term interest rate in the data set less 1.45%, which is the average difference between the 10-year Treasury note yield and the 3-month Treasury bill yield since April 1953 (the earliest month available for both series). This estimate may not be representative for pre-1950s data.
- Dividends accrue while in stocks, with one twelfth of the annual yield paid each month and frictionless monthly reinvestment. This dividend smoothing assumption could bias results, and frictionless reinvestment of dividends is optimistic.
- Baseline trading friction for moving in and out of the S&P 500 Composite Index is a constant 1% over the sample period. This assumption is very crude, as indicated in “Trading Frictions Over the Long Run”. Given the challenges of constructing a portfolio from index components during much of the sample period, this baseline value may be optimistic. For recent data, it is pessimistic. Trading friction may be elevated during some exit signals (market crashes).
- Ignore the tax implications of trading.
The limitations of these assumptions, as well as those of the interpolation methods used in constructing the early part of the source data set, make this analysis more of a concept exploration than a strategy test.
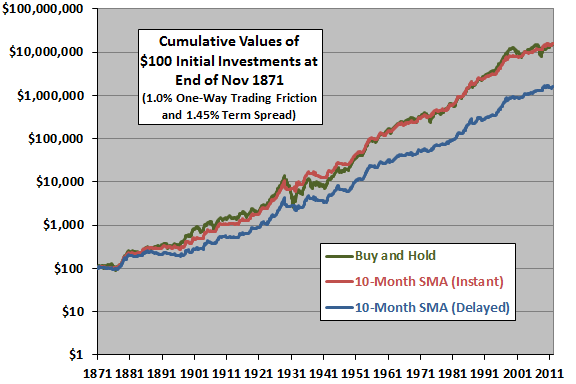
The following chart plots on a logarithmic scale the cumulative values of $100 initial investments at the end of November 1871 (to enable calculation of a 10-month SMA) in: (1) buying and holding the S&P Composite Index; (2) switching between the index and cash based on 10-month SMA crossing signals with no delay (instant) for the baseline trading friction and term spread; and, (3) switching between the index and cash based on 10-month SMA crossing signals with a one-month delay for the baseline trading friction and term spread. Over the entire sample period, the 10-month SMA timing strategy is in stocks 61.9% of the time.
For baseline parameter values, the 10-month SMA timing strategy implemented instantly performs about the same as a buy-and-hold strategy. Delaying execution of SMA signals by one month materially reduces performance.
Over the entire sample period for baseline parameter values, the average monthly total return for the instant 10-month SMA timing (buy-and-hold) strategy is 0.75% (0.79%), with standard deviation of monthly returns 2.73% (4.10%) and average monthly total return per unit of realized volatility therefore 0.27 (0.19). For the delayed 10-month SMA timing strategy, results are 0.61%, 2.70% and 0.23, respectively.
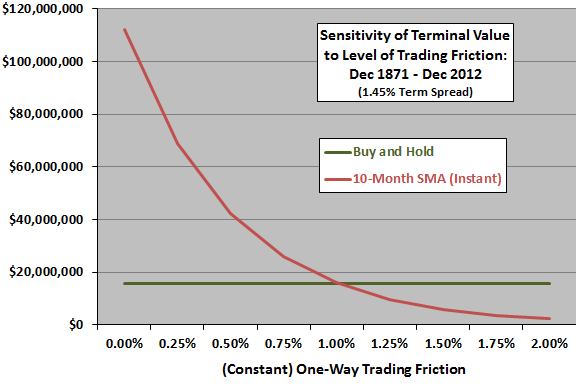
How sensitive are results to the assumed constant level of trading friction?
The next chart plots terminal values for the instant 10-month SMA timing and buy-and-hold strategies for various constant levels of trading friction, ranging from 0% to 2% (and baseline term spread 1.45%). The break-even level of one-way trading friction is approximately the baseline level of 1%. The performance of the 10-month SMA timing strategy is very sensitive to the assumed level of trading friction. Ignoring trading friction makes the timing strategy appear extremely attractive. However, high transaction costs and bid-ask spreads may have precluded usefulness of the signal for much of the sample period.
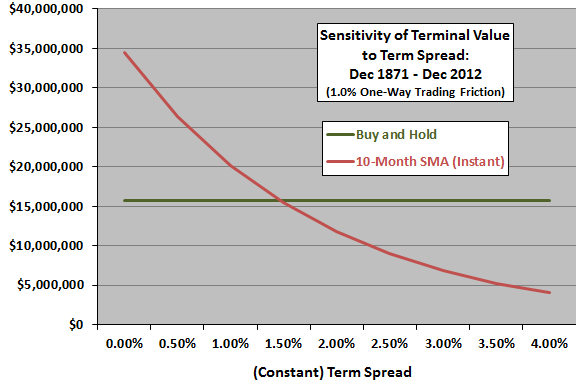
How sensitive are results to the assumed return on cash (constant level of term spread)?
The next chart plots terminal values for the instant 10-month SMA timing and buy-and-hold strategies for various constant levels of the term spread, ranging from 0% to 4% (and baseline one-way trading friction 1%). The break-even term spread is approximately 1.5%, close to the baseline level. The performance of the 10-month SMA timing strategy is sensitive to the assumed return on cash. Ignoring the return on cash makes buy-and-hold appear attractive.
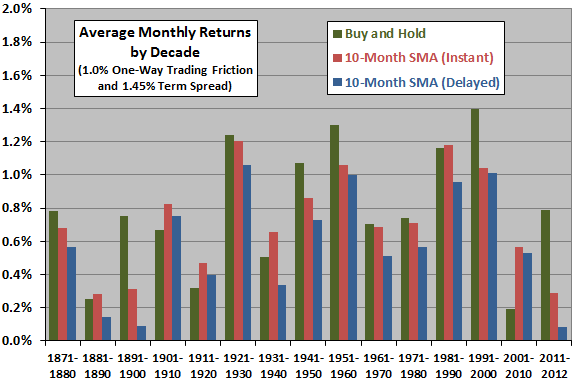
For additional insight, we examine SMA timing strategy performance by decade.
The next chart shows average monthly total returns by decade for buy-and-hold and both instant and delayed 10-month SMA timing strategies with baseline parameters. The last decade is obviously partial only.
Based on this metric, the instant 10-month SMA timing (buy-and-hold) strategy wins six (nine) of 15 decades. The most notable decade for SMA outperformance is 2001-2010.
What about the volatilities of these returns?
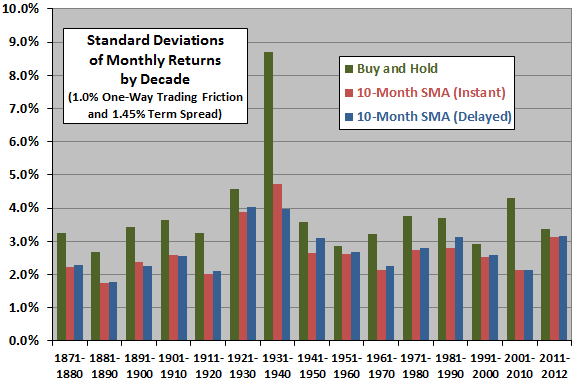
The next chart shows standard deviations of monthly total returns by decade for buy-and-hold and both instant and delayed 10-month SMA timing strategies with baseline parameters.
Based on this metric, the instant 10-month SMA timing (buy-and-hold) strategy wins 15 (0) of 15 decades.
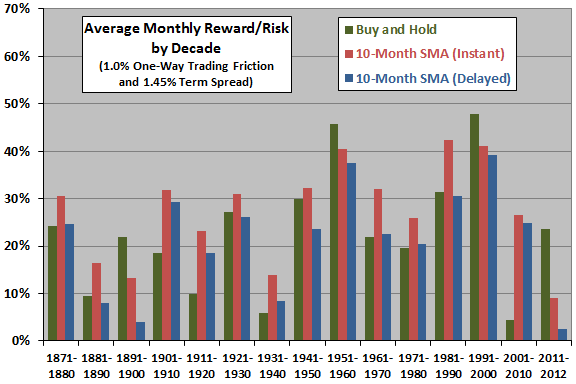
What about reward per unit of risk?
The final chart shows average monthly total returns per unit of risk (realized volatility) by decade for buy-and-hold and both instant and delayed 10-month SMA timing strategies with baseline parameters.
Based on this combination metric, the instant 10-month SMA timing (buy-and-hold) strategy clearly wins 11 (four) of 15 decades.
In summary, evidence from crude modeling over the long run suggests that 10-month SMA timing signals are potentially beneficial, with their value deriving mostly from protection against rare market crashes. However, this finding is shaky because of its sensitivities to assumptions about trading frictions and return on cash.
Cautions regarding findings include:
- As noted, the index calculation method is not well-suited to SMA crossing signals. The test is actually something like a 20-day SMA crossing a 200-day SMA (but sampled only once each month).
- As noted, modeling of trading frictions and return on cash is crude. Precise modeling is intractable.
- Ignoring taxes materially benefits the timing strategies relative to buy-and-hold.
- Use of an index, rather than a tradable asset, tends to overstate returns by ignoring the costs of establishing and maintaining a liquid asset. Older data may be less reliable than recent data.
- Using an interval other than 10 months for SMA calculation may produce different results, depending on the relationship between the interval selected and the empirical durations of market trends during the sample period (see “Is There a Best SMA Calculation Interval for Long-term Crossing Signals?”).