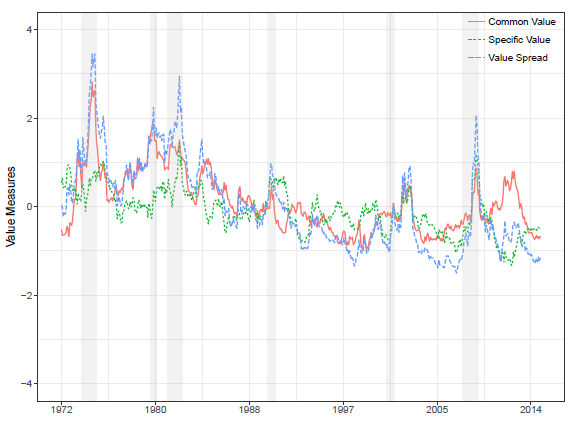
Do value strategy returns vary exploitably over time and across asset classes? In their October 2017 paper entitled “Value Timing: Risk and Return Across Asset Classes”, Fahiz Baba Yara, Martijn Boons and Andrea Tamoni examine the power of value spreads to predict returns for individual U.S. equities, global stock indexes, global government bonds, commodities and currencies. They measure value spreads as follows:
- For individual stocks, they each month sort stocks into tenths (deciles) on book-to-market ratio and form a portfolio that is long (short) the value-weighted decile with the highest (lowest) ratios.
- For global developed market equity indexes, they each month form a portfolio that is long (short) the equally weighted indexes with book-to-price ratio above (below) the median.
- For each other asset class, they each month form a portfolio that is long (short) the equally weighted assets with 5-year past returns below (above) the median.
To quantify benefits of timing value spreads, they test monthly time series (in only when undervalued) and rotation (weighted by valuation) strategies across asset classes. To measure sources of value spread variation, they decompose value spreads into asset class-specific and common components. Using monthly data for liquid U.S. stocks during January 1972 through December 2014, spot prices for 28 commodities during January 1972 through December 2014, spot and forward exchange rates for 10 currencies during February 1976 through December 2014, modeled and 1-month futures prices for ten 10-year government bonds during January 1991 through May 2009, and levels and book-to-price ratios for 13 developed equity market indexes during January 1994 through December 2014, they find that:
- Value spreads capture the strength of value signals, which varies considerably over time (see the chart below). Regressions with next-year returns have R-squared statistics 0.14, 0.10, 0.22, 0.09 and 0.11 for individual U.S. stocks, global stock indexes, global government bonds, commodities and currencies, respectively.
- Gross Sharpe ratios of strategies that exploit variation in value spreads are typically about twice those of value strategies that do not. It is likely that value investing is attractive only when the value spread for an asset class is high relative to its own historical average and to value spreads of other asset classes.
- For individual U.S. stocks (excluding financials) the value spread generates average monthly gross return 0.28%, with annualized gross Sharpe ratio 0.20. Accounting for variation of valuation ratios across industries improves performance.
- Combining asset classes via binary (in or out) timing of the time series of each generates average monthly gross return 0.65%, with annualized gross Sharpe ratio 0.52.
- Combining asset classes by overweighting (underweighting) those having relatively higher (lower) value spreads generates average monthly gross return 0.50%, with annualized gross Sharpe ratio 0.44.
- Within asset classes, using several measures to calculate the value spread generally enhances value spread timing. For example, aggregating value spreads based on book-to-market, earnings-to-price and sales-to-price ratios works better than just using book-to-market ratio.
- Correlations between value spreads for different asset classes vary in size and magnitude. Asset class-specific and common components contribute about equally to value spread predictability. The common component relates strongly to such broad risk indicators as dividend yield, default spread and illiquidity.
The following chart, taken from the paper, tracks variation in the value spread for individual U.S. stocks excluding financial stocks as specified above (dashed blue line). A positive (negative) spread indicates that value stocks are cheaper (more expensive) than usual. The chart also tracks the average value spread across asset classes (Common Value, red line) and the residual value spread for U.S. stocks (Specific Value, dotted green line). Results indicate that the value spread varies considerably over time and that the spread for U.S. stocks may decline over time.

In summary, evidence indicates that long-term investors may be able to exploit value spreads in aggregate across asset classes, with some value spreads defined simply based on long-term return reversion.
Cautions regarding findings include:
- Sample periods are not long, especially in terms of number of independent 5-year return measurement intervals where used to measure value spreads.
- Reported results are gross, not net.
- Use of commodity and currency spot prices and equity indexes as assets ignores costs of creating and maintaining liquid funds from these series.
- Accounting for portfolio rebalancing costs would reduce portfolio returns.
- Accounting for shorting costs and constraints would reduce long-short portfolio returns.
- The authors incur data snooping bias in testing multiple variations when measuring the predictive power and economic value of value spreads, such that the best-performing variations overstate expectations. Also, value spread measurements and strategy test setups involve several parameters subject to snooping bias.
See also: