The authors of the study summarized in “Exploit ETN Deviation from Indicative Value?” argue that deviations of prices for exchange-traded notes (ETN) from their indicative (immediate redemption) values may be useful as trading signals. How well does this mispricing concept work for the very liquid iPath S&P 500 VIX Short-term Futures ETN (VXX)? To check, we consider several mispricing thresholds and measure the short-term profitability of both long and short trades based on these thresholds. Using daily split-adjusted opening and closing prices and closing indicative values for VXX from inception at the end of January 2009 through mid-September 2012 (916 trading days), we find that:
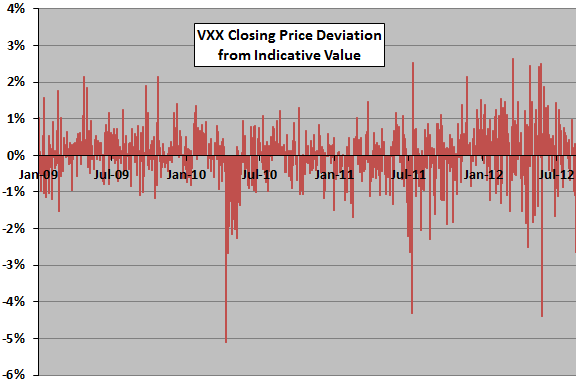
The following chart shows the deviations of VXX daily closing prices from its daily indicative values over the sample period. The average deviation is 0.02%, with standard deviation 0.77%. VXX is overvalued at the close on 53% of trading days, but never by as much as 3%. VXX is undervalued at the close on 44% of trading days, by as much as 3% three times. It appears that extreme mispricings are generally very short-lived.
Is trading extreme mispricings viable?

To generate trade signals, we consider VXX daily closing price deviations from same-close indicative value greater than 1%, 2% or 3%. To measure profitability of these signals, we use the return from next open to next close. Since VXX is very liquid, we impose round-trip trading friction of only 0.1%.
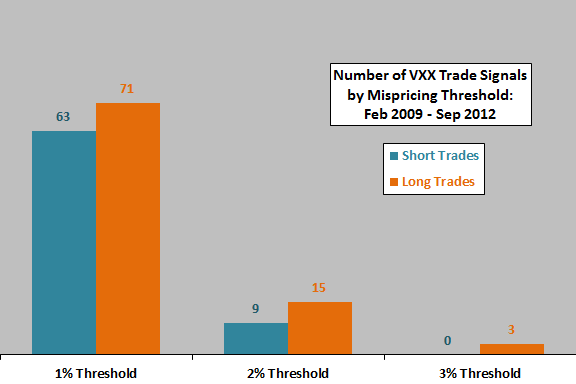
The next chart summarizes the number of short (VXX overvalued) and long (VXX undervalued) trades signals generated for each threshold. In contrast to the findings described in “Exploit ETN Deviation from Indicative Value?”, there are more long than short trade signals. Even for long trades, there is less than one trade signal per year at the 3% threshold.
What about profitability of trade signals?

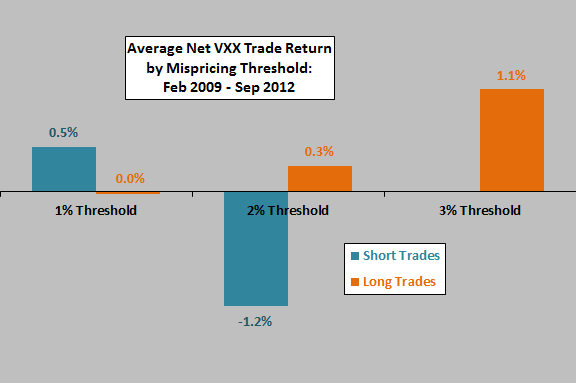
The final chart summarizes average net VXX next-day open-to-close return for short and long trades for each of the three signal thresholds. Results suggest that:
- Average returns for short trades are inconsistent. For the profitable 1% threshold, the standard deviation of trade returns is a fairly high 4.0%.
- Average returns for long trades are mostly uninteresting. Among the three trades for the profitable 3% threshold, one is a loss of -6.6%.

In summary, evidence from simple tests offers very little support for a belief that indicative value is a useful measure of VXX mispricing.
Cautions regarding findings include:
- Holding periods longer than one day may alter findings, but the steady deterioration of VXX price due to trading frictions and a usually negative roll return for the underlying short-term VIX futures may dominate trade signal informativeness.
- Traders with small accounts may not be able to achieve the assumed level of trading friction.
- Shorting costs, ignored in the above analysis, may be material for short trades.