Is there a straightforward way to incorporate current business/economic climate into equity market valuation ratios? In their September 2016 paper entitled “Generalized Financial Ratios to Predict the Monthly Equity Market Premium”, Andres Algaba and Kris Boudt introduce and test a generalized price-dividend ratio (GDPR) that takes into account recent business and discount rate conditions, as follows:
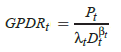
Where P is equity market (index) price, D is aggregate market dividend, the beta exponent for D accounts for changes in the kinds of companies dominating the market (those that retain versus those that pay out earnings) and the lambda multiplier for D accounts for variation in the discount rate used to evaluate dividend streams. The t subscripts indicate that all vary over time. They estimate beta and lambda via regressions using rolling historical windows of five or nine years (representing two views of business cycle length). They test the ability of GPDR to predict the U.S. equity market premium (ERP) using inception-to-date forecasting regressions, without and with a rule that switches to the historical average ERP when recent (last three and six months) GPDR predictions are poor. They use the historical average ERP as a benchmark. They employ the first nine years of data to estimate initial GPDR. They then use the next 20 years (1956-1975) for the first predictive regression, leaving 39 years for out-of-sample monthly ERP predictions (1976-2014). To assess the economic value of using GPDR to predict ERP, they consider a risk-averse, mean-variance optimizing investor who each month reallocates across equities and U.S. Treasury bills (T-bills). This investor employs a 5-year rolling window to estimate volatility, does not sell short and limits leverage to 1.5 with one-way trading friction 0.1%. Using monthly levels of the S&P 500 Index, monthly 12-month historical dividends and monthly 3-month T-bill yield as the risk-free rate during January 1947 through December 2014, they find that:
- In terms of cumulative squared ERP prediction errors:
- The predictive regression based on GPDR with parameters estimated from 5-year historical windows outperforms both historical average and traditional price-dividend ratio.
- The predictive regression based on GPDR with parameters estimated from 9-year historical windows outperforms only the traditional price-dividend ratio.
- Including the prediction switching rule when GPDR is recently inaccurate significantly
outperforms the historical average for both 5-year and 9-year parameter estimation windows. The switching rule also improves performance of the traditional price-dividend ratio.
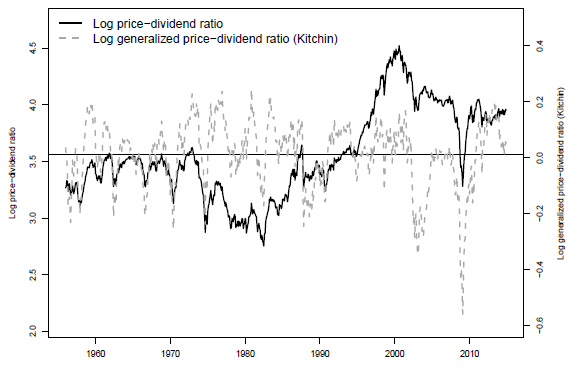
- From visual inspection of GPDR and traditional price-dividend ratio time series (see the chart below), GPDR better profits during booms but is less unable to avoid busts. Including the prediction switching rule when GPDR is recently inaccurate helps avoid busts but also misses booms.
- Regarding the economic value of using GPDR to predict ERP:
- Using a GDPR (5-year estimation window) regression to predict ERP with no prediction switching rule outperforms the historical average ERP based on net annualized return (12.9% versus 9.3%) and net Sharpe ratio (0.49 versus 0.31).
- Adding the rule to switch to historical ERP when recent GPDR forecasts are bad does not improve basic GPDR performance (net annualized return 12.0% and net Sharpe ratio 0.47).
- The 5-year GPDR parameter estimation window materially outperforms the 9-year estimation window.
- The generalization methodology is applicable to other fundamental valuation ratios, but GPDR with a 5-year parameter estimation window produces the most accurate forecasts.
The following chart, taken from the paper, shows differences between logarithms of traditional price-dividend ratio and GPDR (with parameters estimated from 5-year historical window, referred to as the Kitchin business cycle) since 1956. Respective scales put the series averages at the same level on the vertical scales. GPDR crosses its mean more frequently than the traditional ratio and appears more likely to be mean reverting.
In summary, evidence indicates that including an exponent and multiplier with the dividend part of the price-dividend ratio to account for recent business/economic conditions may usefully enhance its predictive power.
Cautions regarding findings include:
- There may be material snooping bias in the selection of historical window lengths used to estimate the beta and lambda parameters for GPDR. Per the paper: “Exploratory analyses (available from the authors upon request) indicate that…” Even evaluating just two lengths introduces some bias.
- There may also be material snooping bias in the selection of three and six months windows of poor GPDR prediction performance as a signal to switch to the historical average ERP.
- The assumed 0.1% stocks-cash switching friction is unreasonably low for much of the sample period.
See also the very simple “Real Earnings Yield (REY) Model”.