Does aggregate investor sentiment affect the strength of well-known U.S. stock return anomalies? In their January 2011 paper entitled “The Short of It: Investor Sentiment and Anomalies”, Robert Stambaugh, Jianfeng Yu and Yu Yuan explore the interaction of aggregate investor sentiment with 11 cross-sectional stock return anomalies. Their approach reflects expectations that: (1) overpricing of stocks is more common than underpricing due to short-sale constraints; and, (2) a high sentiment level amplifies overpricing. Specifically, they consider the effect of investor sentiment on hedge portfolios that are long (short) the highest(lowest)-performing) value-weighted deciles of stocks sorted on: financial distress (two measures), net stock issuance, composite equity issuance, total accruals, net operating assets, momentum, gross profit-to-assets, asset growth, return-on-assets and investment-to-assets. They use a long-run sentiment index derived from principal component analysis of six sentiment measures: trading volume as measured by NYSE turnover; the dividend premium; the closed-end fund discount; the number of and first-day returns on Initial Public Offerings; and, the equity share in new issues. They measure anomaly alphas relative to the three-factor model (adjusting for market, size, book-to-market). Using monthly sentiment and stock return anomaly data as available over the period July 1965 through January 2008, they find that:
- All 11 hedge portfolios produce significantly positive average gross excess returns (relative to one-month Treasury bills) and gross three-factor alphas. The average monthly gross alpha for anomaly portfolios weighted equally is 0.87%, ranging from 0.43% for composite equity issuance to 1.77% for momentum.
- All anomalies are stronger following relatively high levels of sentiment. On average across anomalies, 70% of hedge portfolio gross alpha occurs in months following above-median sentiment. Time-series regressions confirm that anomaly alphas relate positively to investor sentiment.
- Anomaly amplification comes from the short side. On average across anomalies, 78% of the gross alpha from short sides of hedge portfolios occurs in months following above-median sentiment. Time-series regressions confirm that short-side returns relate negatively to investor sentiment.
- Conversely, there is no relationship between long-side alphas and investor sentiment. On average across anomalies, the difference in long-side monthly alpha after high and low sentiment months is only 0.04%.
- Results also generally hold for a processed version of the University of Michigan Consumer Sentiment Index.
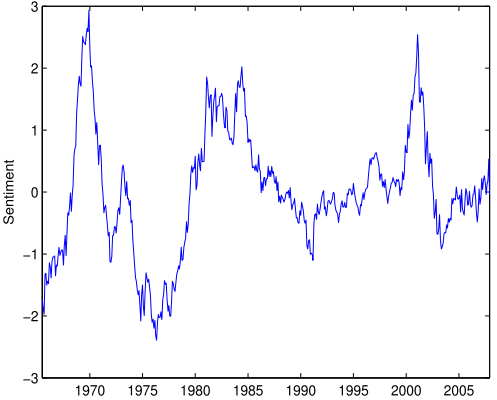
The following chart, taken from the paper, plots the aggregate investor sentiment index used in the study over the sample period. The sentiment index is a dynamic distillation of the six raw sentiment measures identified above, adjusted for several macroeconomic indicators and a dummy variable for NBER recessions. Note that such variables (especially NBER recession dates) are not known in real time, indicating look-ahead bias. Moreover, the study apparently uses the overall sample median as a high-low threshold for sentiment. Because of the wide swings in sentiment, the medians for exploitable to-date and rolling historical data are often very different from the overall sample median.

In summary, evidence suggests that investors may be able to enhance results for hedge strategies that exploit common stock return anomalies by concentrating on intervals when aggregate investor sentiment is high.
Cautions regarding these findings include:
- As noted above, there appear to be two sources of look-ahead bias in the aggregate investor sentiment index used in the study. Eliminating this bias by using only real-time data may substantially affect findings.
- Reported returns and alphas are gross, not net. Including reasonable trading frictions for monthly portfolio rebalancing would likely degrade anomaly profitabilities substantially. Incremental trading to incorporate investor sentiment signals would add to trading frictions. Also, trading frictions may be systematically related (via liquidity) to investor sentiment such that trading is more costly when sentiment is high.
- The sentiment indexes used are complex or involve some complex adjustments. It would be interesting to know whether findings for some simpler real-time measure of aggregate investor sentiment are exploitable.
- It would be interesting to see how the 2008-2009 financial crisis affects findings.
See “Investor Sentiment and Returns for Different Types of Stocks” for a similar study considering other firm characteristics.