Do economic expectations of sophisticated investors relative to those of unsophisticated investors predict stock market returns? In the September 2020 revision of his paper entitled “Relative Sentiment and Machine Learning for Tactical Asset Allocation”, flagged by a subscriber, Raymond Micaletti investigates use of relative Sentix sentiment for tactical asset allocation. He each month constructs relative sentiment factors for regional U.S., Europe, Japan and Asia ex-Japan equity markets as differences in 6-month economic expectations between respective institutional and individual investors. He then applies machine learning algorithms to test 990 alternative strategies of relative sentiment for each region, augmented by both cross-validation and adjusted for data snooping. He tests usefulness of the most significant backtest results in two ways:
- Translation of relative sentiment to equity allocations ranging from 0% to 100% for each equity market, with the non-equity allocation going to either bonds or cash. As benchmarks, he uses the average monthly equity allocation of relative sentiment strategies, with the balance allocated to bonds or cash, rebalanced monthly.
- Ranking of regions by relative sentiment to predict which equity markets will be outperformers and underperformers next month.
Using monthly Sentix sentiment data as described, monthly returns for associated equity market indexes and spliced exchange-traded funds (ETF) and monthly returns for the Barclays US Aggregate Bond Index during August 2002 through September 2019 (with a 3-month gap in sentiment data during October 2002 through December 2002), he finds that:
- Relative sentiments identify greater numbers of significant strategies overall and strategies with extremely high significance than do separate institutional and individual investor sentiments. Depending on the region (strongest in the U.S.), dozens to several hundred strategies exhibit significant outperformance after adjusting for data snooping.
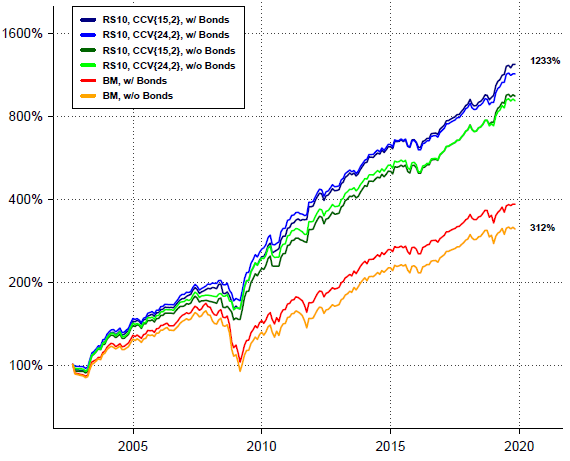
- A portfolio of the top 10 U.S. strategies beats the corresponding portfolio of benchmarks by 6.5% to 7% per year over the sample period (see the first chart below), with higher Sharpe ratios and shallower maximum drawdowns.
- Relative sentiment is more informative than intrinsic (time series or absolute) momentum, particularly when momentum is negative. Average annualized return across all regions when relative sentiment is positive (negative) and momentum is negative is 27% (-23%). There is a similar but weaker result when momentum is positive.
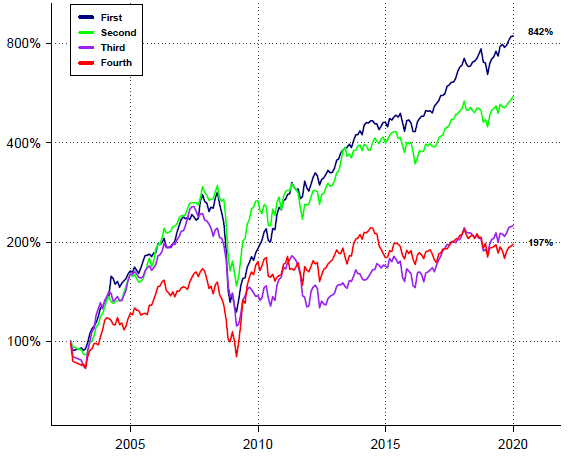
- Returns of top 10 relative sentiment portfolios vary somewhat systematically with relative sentiment rank across regions (see the second chart below). Cumulative performance for the top rank is 842% over the test period, while that for the fourth rank is just 197%.
The following chart, taken from the paper, tracks gross cumulative performances of four portfolios of top 10 of 990 U.S. relative sentiment strategies (RS10) based on two combinatorial cross-validation approaches (CCV{15,2} and CCV{24,2}), both with and without bonds, along with those for respective benchmark portfolios (BM). Notable points are:
- Relative sentiment portfolios strongly and persistently outperform benchmark portfolios.
- Relative sentiment portfolios with bonds outperform those with cash.
- Relative sentiment portfolios avoid some, but not all, of the 2008-2009 equity market crash.
- Exact cross-validation parameters are not important.

The next chart, also from the paper, tracks gross cumulative performances of portfolios of the top 50 relative sentiment strategies for each region by regional rank based on relative sentiment. Portfolio performance often, though not consistently, increases from the fourth to the first rank. However, the second rank sometimes leads the first rank, and the fourth rank sometimes leads the third rank.

In summary, evidence indicates that the difference in Sentix sentiment between sophisticated and unsophisticated investors re 6-month economic expectations has value for tactical allocation to equities at a monthly horizon.
Cautions regarding findings include:
- Performance data are gross, not net. Monthly reallocation frictions would reduce all returns. The author posits that these frictions are small compared to reported performance gains because the assets are simple and liquid. Including costs of Sentix sentiment data and machine learning software/expertise would also reduce performance.
- The methodology is beyond the reach of most investors, who would bear fees for delegating portfolio maintenance to a fund manager.
- As noted, relative sentiment strategies suffer considerable drawdowns during the 2008-2009 equity market crash.
- An investor operating in real time during the sample period would not know which relative sentiment strategies perform best over the sample period. Given overall complexity of the testing, a true out-of-sample test would be valuable.
- Also, the benchmark equity allocation for time series tests is known only retrospectively based on the full sample of relative sentiment allocations.
- The data/methodology are not available in real time over the full sample period, such that there can be no associated market feedback.
See also “Smart Money Indicator for Stocks vs. Bonds”, “Verification Tests of the Smart Money Indicator” and “Smart Money Indicator Verification Update”.