“Verification Tests of the Smart Money Indicator” performs tests of ideas and setup features described in “Smart Money Indicator for Stocks vs. Bonds”. The Smart Money Indicator (SMI) is a complicated variable that exploits differences in futures and options positions in the S&P 500 Index, U.S. Treasury bonds and 10-year U.S. Treasury notes between institutional investors (smart money) and retail investors (dumb money) as published in Commodity Futures Trading Commission Commitments of Traders (COT) reports. Since findings for some variations in that test are attractive, we add two further robustness tests:
- Extend the sample period in “Verification Tests of the Smart Money Indicator” through the end of March 2020 to see how SMI performs during the 2019 coronavirus (COVID-19) stock market crash.
- Using the same setup as in “Verification Tests of the Smart Money Indicator”, test alternate definitions of commercial traders as smart money and non-commercial traders as dumb money (from legacy reports), rather than asset manager/institutional traders and non-reportables, respectively (from more granular disaggregated reports).
Using COT report data, dividend-adjusted SPDR S&P 500 (SPY) as a proxy for a stock market total return index, 3-month Treasury bill (T-bill) yield as return on cash (Cash) and dividend-adjusted iShares 20+ Year Treasury Bond (TLT) as a proxy for government bonds during 6/16/06 through 4/3/20, we find that:
The following table summarizes net performance statistics that update those in “Verification Tests of the Smart Money Indicator” through 4/3/2020. SPY-Cash switches between SPY and T-bills based on SMI. SPY-TLT switches between SPY and TLT. No Lag means any trades occur at the close on COT report publication data, with trades for 1-week Lag and 2-week Lag delayed accordingly. Compared to initial verification tests, notable points are:
- All compound annual growth rates (CAGR) are much lower because neither SPY nor any of the SMI strategy variations avoid the COVID-19 crash.
- Maximum drawdowns (MaxDD) for 1-week lag variations are much lower, again because these variations do not avoid the COVID-19 crash.
As noted in initial verification tests, the sharpness of improvements for a 1-week lag, in the absence of a behavioral explanation for its superiority, raises concern that this lag is just very lucky.
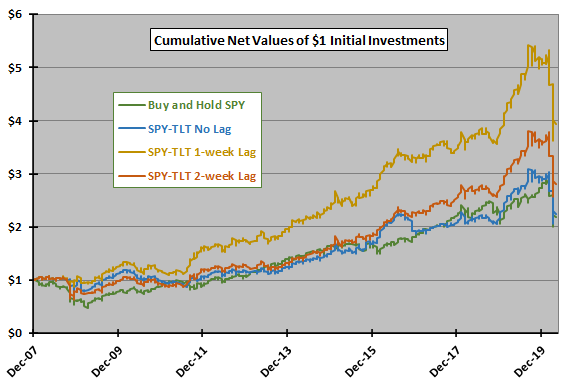
For perspective, we look at cumulative performance of SPY-TLT.

The next chart updates cumulative performances of the benchmark and SPY-TLT timing for the three signal execution lags over the extended sample period, with the COVID-19 stock market crash evident at the end.
What happens for the alternative definitions of smart money and dumb money?

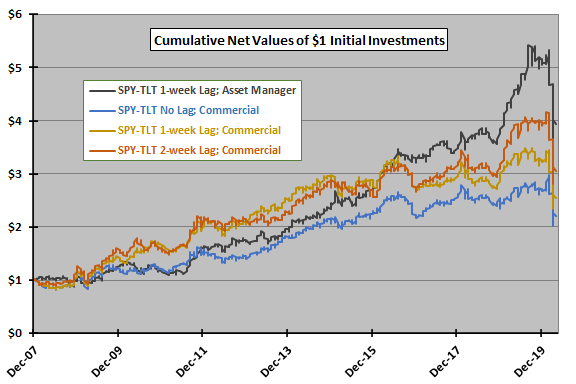
The final chart compares cumulative performances of four SPY-TLT timing alternatives over the extended sample period:
- SPY-TLT 1-week Lag; Asset Manager – the best performing variation from above with asset manager/institutional traders as smart money and non-reportables as dumb money.
- SPY-TLT No Lag; Commercial – commercial traders as smart money and non-commercial traders as dumb money, with no lag between signal and trades.
- SPY-TLT 1-week Lag; Commercial – commercial traders as smart money and non-commercial traders as dumb money, with 1-week lag between signal and trades.
- SPY-TLT 2-week Lag; Commercial – commercial traders as smart money and non-commercial traders as dumb money, with 2-week lag between signal and trades.
Notable findings are:
- Commercial variations are in stocks a little more (45% of weeks versus 43%) and switch a few more times (66 times versus 61) than Asset Manager variations.
- Full-sample CAGR and MaxDD for Commercial with 1-week lag are 7.9% and -33%, compared to 11.8% and -33% for Asset Manager with 1-week lag. The large difference in CAGRs suggests that definitions of smart money and dumb money are imprecise.
- The best Commercial variation over the full sample period is 2-week Lag (CAGR 9.5% and MaxDD -32%), undermining confidence that differences across lags are behavioral rather than random. Different variations win different subperiods.
In general, testing more variations on the same sample elevates data snooping bias, lowering confidence in the best result. In this case, snooping means landing on the best weeks to make the 61 or 66 trades signaled by SMI.

In summary, verification updates/extensions indicate that U.S. stock market timing based on some variations of the Smart Money Indicator may be very attractive, subject to concern about signal execution lag snooping bias and smart/dumb money definition snooping bias.
Cautions regarding findings include:
- Cautions in “Verification Tests of the Smart Money Indicator” apply.
- As noted, difference in performance generally between Asset Manager and Commercial smart money definitions undermine confidence that there is a reliable definition.
- As noted, the difference in optimal lags between full-sample Asset Manager and Commercial smart money definitions undermines confidence a reliable best lag.